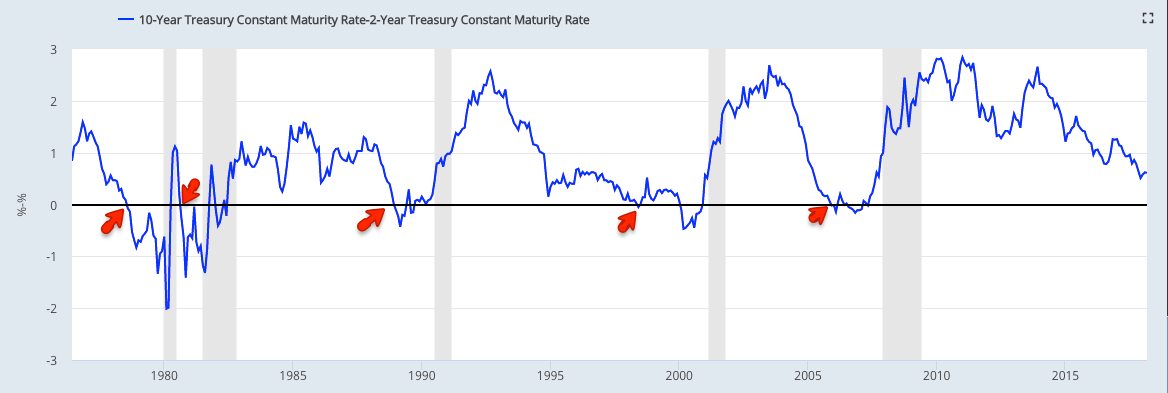
The bond market agrees with the macro data. The yield curve has 'inverted' (10 year yields less than 2-year yields) ahead of every recession in the past 40 years (arrows). The lag between inversion and the start of the next recession has been long: at least a year and in several instances as long as 2-3 years. On this basis, the current expansion will likely last through 2018 at a minimum. Enlarge any image by clicking on it.
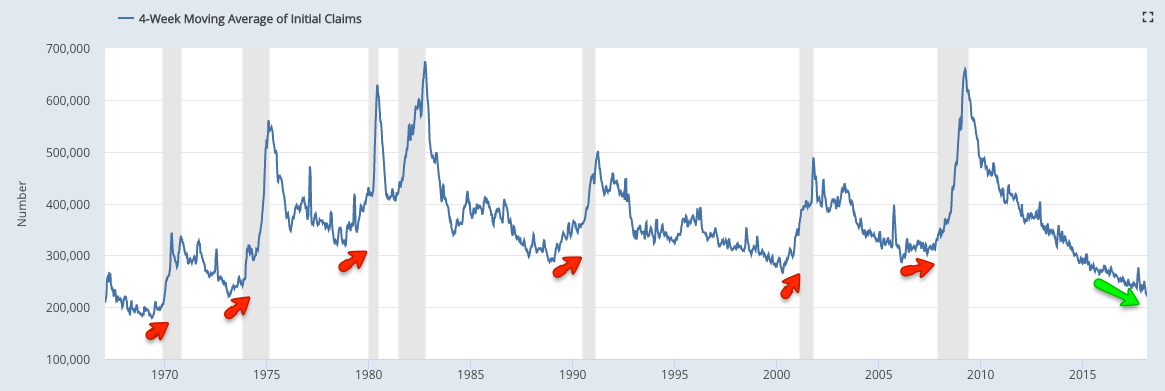
Unemployment claims are also in a declining trend, reaching a new 48 year low in mid-March. Historically, claims have started to rise at least 6 months ahead of the next recession.
New home sales made a new 10 year high in November. In the past 50 years, more than a year has lapsed between the expansion's high print in new home sales and the start of the next recession.

Real retail sales (excluding food) made a new all-time high (ATH) in November. The trend higher is strong, in comparison to the period prior to the past two recessions.

Here are the main macro data headlines from the past month:
Employment: Monthly employment gains have averaged 188,000 during the past year, with annual growth of 1.5% yoy. Employment has been been driven by full-time jobs, which rose to a new all-time high in February.
Compensation: Compensation growth is on an improving trend. Hourly wage growth was 2.7% yoy in March, while the 4Q17 employment cost index grew 2.8% yoy, the highest growth in the past 9 years.
Demand: Real demand growth has been 2-3%. In February, real personal consumption growth was 2.8%. Real retail sales (excluding food) grew 1.9% yoy in February. It made its most recent ATH in November.
Housing: New home sales grew 0.5% yoy in February. Housing starts were at the highest level of the past 10 years in January, but fell 4% yoy in February. Multi-family units remain a drag on overall development.
Manufacturing: Core durable goods rose 6.6% yoy in February, close to the best annual growth rate in 4 years. The manufacturing component of industrial production grew 2.7% yoy in February, the highest rate of growth in 4 years.
Inflation: The core inflation rate remains near (but under) the Fed's 2% target.
This is germane to equity markets in that macro growth drives corporate revenue, profit expansion and valuation levels. The simple fact is that equity bear markets almost always take place within the context of an economic decline. Since the end of World War II, there have been 10 bear markets, only 2 of which have occurred outside of an economic recession (read further here).
The highly misleading saying that "the stock market is not the economy" is true on a day to day or even month to month basis, but over time these two move together. When they diverge, it is normally a function of emotion, whether measured in valuation premiums/discounts or sentiment extremes.
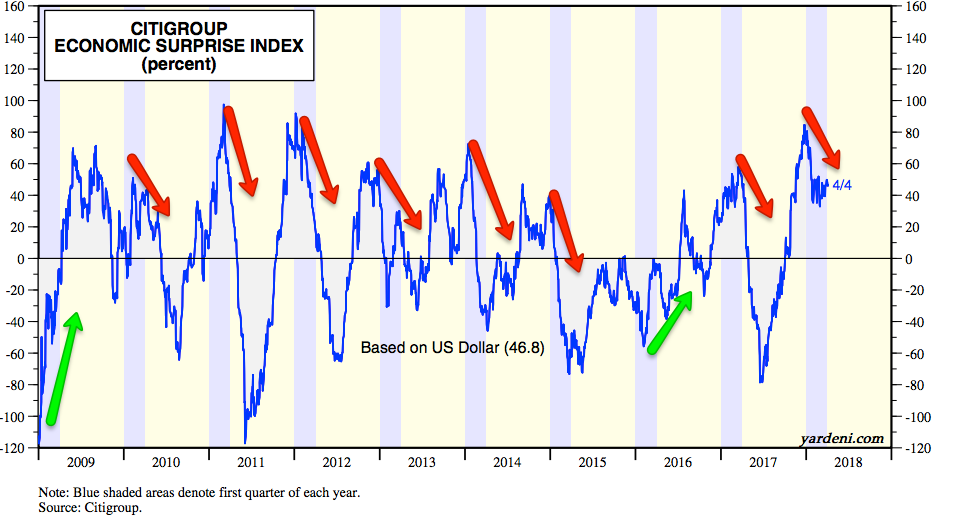
Macro data will likely underperform expectations in 1H18. Why? Macro data ended 2017 well ahead of expectations. During the current expansion, that has led to underperformance of macro data relative to expectations into the following mid-year (red arrows). 2009 and 2016 had the opposite pattern: macro data underperformed expectations into the prior year-end and then outperformed in the first half of the year (green arrows).
A valuable post on using macro data to improve trend following investment strategies can be found here.
* * *
Let's review the most recent data, focusing on four macro categories: labor market, end-demand, housing, and inflation.
Employment and Wages
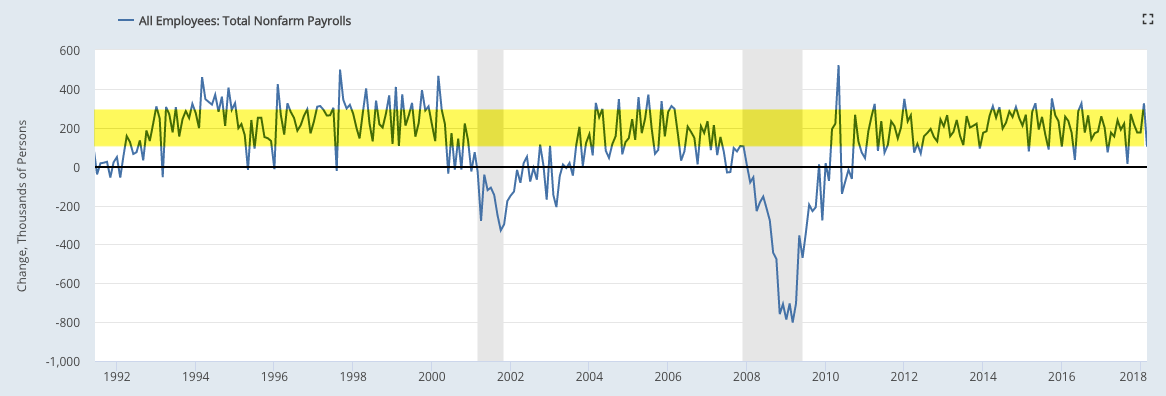
The March non-farm payroll was 103,000 new employees minus 50,000 in revisions for the prior two months.
Employment growth has been decelerating. The average monthly gain in employment was 250,000 in 2014, 226,000 in 2015, 195,000 in 2016 and 181,000 in 2017. In the past 12 months, the monthly average has increased slightly to 188,000.
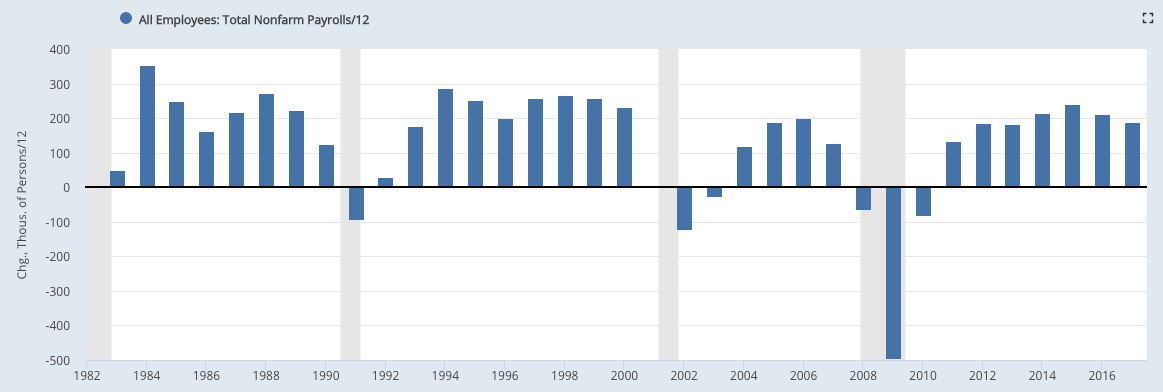
Monthly NFP prints are volatile. Since the 1990s, NFP prints near 300,000 have been followed by ones near or under 100,000. That has been a pattern during every bull market; NFP was negative in 1993, 1995, 1996 and 1997. The low print of 103,000 this month, 73,000 in March 2017 and 14,000 in September 2017 fit the historical pattern. This is normal, not unusual or unexpected.
Why is there so much volatility? Leave aside the data collection, seasonal adjustment and weather issues; appreciate that a "beat" or a "miss" of 80,000 workers in a monthly NFP report is equal to just 0.05% of the US workforce.
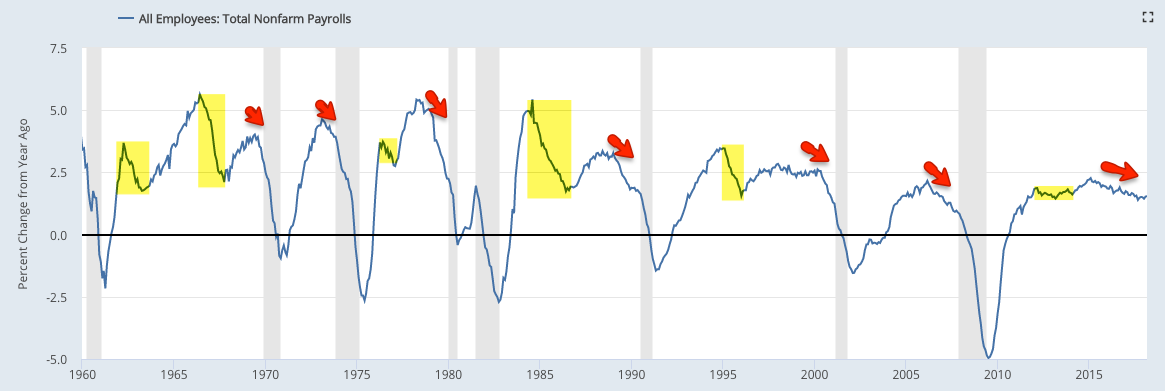
For this reason, it's better to look at the trend; in March, trend employment growth was 1.5% yoy. Until spring 2016, annual growth had been over 2%, the highest since the 1990s. Ahead of a recession, employment growth normally falls (arrows). Continued deceleration in employment growth in the coming months continues to be an important watch out.

The labor force participation rate (the percentage of the population over 16 that is either working or looking for work) has recently stabilized, rising to a 4-year high in February. The participation rate has been falling since 2001 as baby boomers retire, exactly as participation started to rise in the mid-1960s as this demographic group entered the workforce. Another driver is women, whose participation rate increased from about 30% in the 1950s to a peak of 60% in 1999.

Average hourly earnings growth was 2.7% yoy in March. This is a positive trend, showing demand for more workers. Sustained acceleration in wages would be a big positive for consumption and investment that would further fuel employment.

Similarly, 4Q17 employment cost index shows total compensation growth was 2.8% yoy, the highest in the past 9 years.

For those who doubt the accuracy of the BLS employment data, federal tax receipts have also been rising to new highs (red line), a sign of better employment and wages (from Yardeni).

Demand
Regardless of which data is used, real demand has been growing at about 2-3%, equal to about 4-5% nominal.
Real (inflation adjusted) GDP growth through 4Q17 was 2.6% yoy. 2.5-5% was common during prior expansionary periods prior to 2006.

Stripping out the changes in GDP due to inventory produces "real final sales". This is a better measure of consumption growth than total GDP. In 4Q17, this grew 2.9% yoy. A sustained break above 3% would be noteworthy.

The "real personal consumption expenditures" component of GDP (defined), which accounts for about 70% of GDP, grew at 2.8% yoy in 4Q17. This is approaching the 3-5% that was common in prior expansionary periods after 1980.
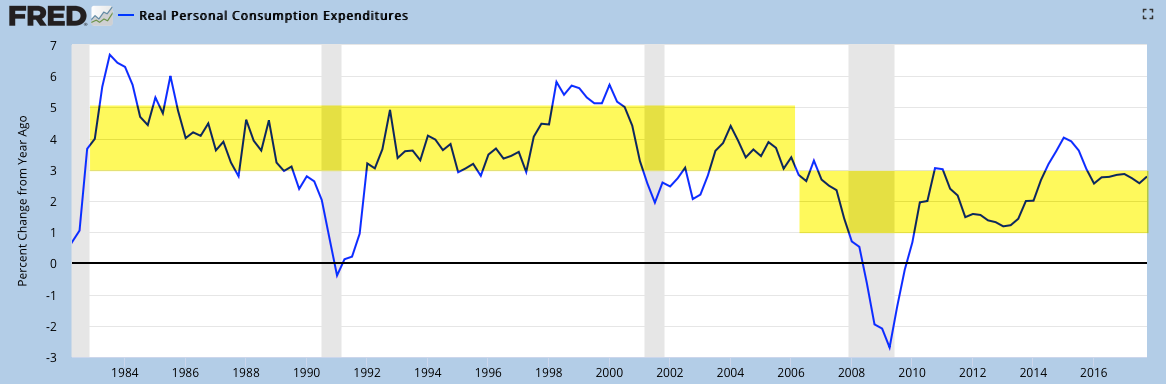
On a monthly basis, the growth in real personal consumption expenditures was 2.8% yoy in February.

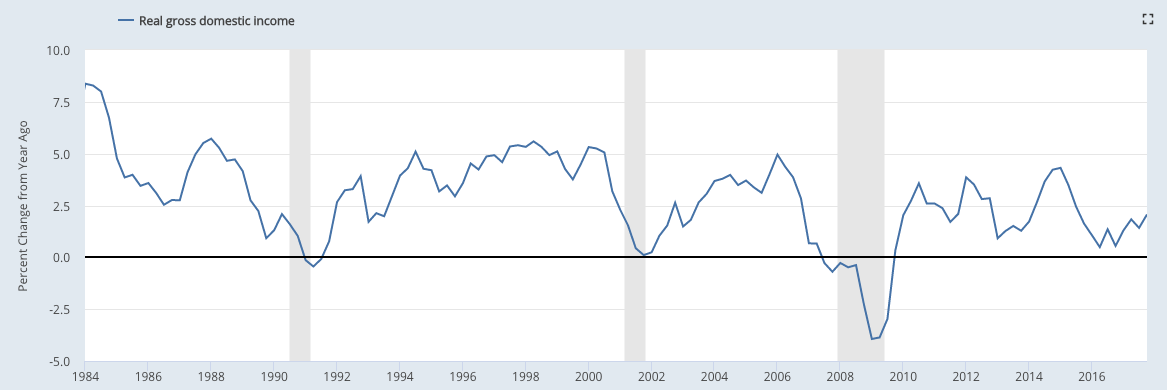
GDP measures the total expenditures in the economy. An alternative measure is GDI (gross domestic income), which measures the total income in the economy. Since every expenditure produces income, these are equivalent measurements of the economy. Some research suggests that GDI might be more accurate than GDP (here).
Real GDI growth in 4Q17 was 2.1% yoy.
Real retail sales grew 1.7% yoy in February. Its most recent ATH was in November, when annual growth was the fastest in 3 years. Sales fell yoy more than a year ahead of the last recession (arrows).

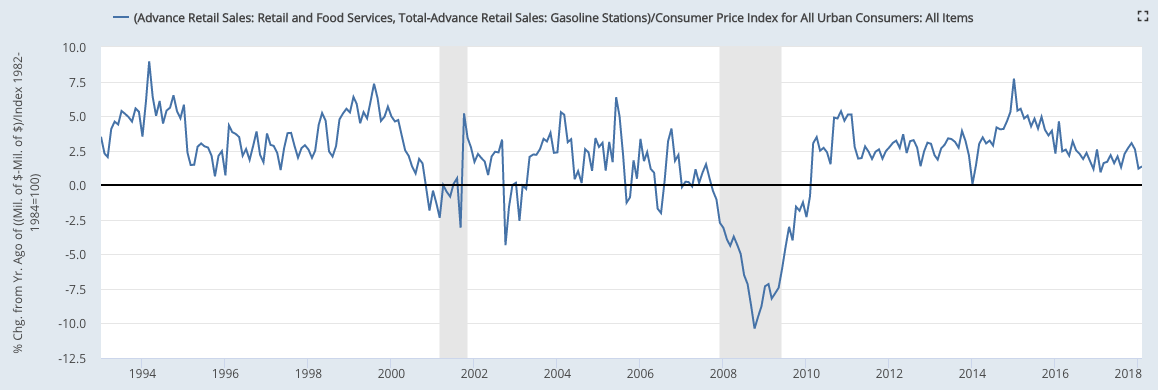
Retail sales in the past two years have been strongly affected by the large fall and rebound in the price of gasoline. In February, real retail sales at gasoline stations grew by 5.5% yoy after having fallen more than 20% yoy during 2016. Real retail sales excluding gas stations grew 1.4% in February. This has been on a weakening trend.
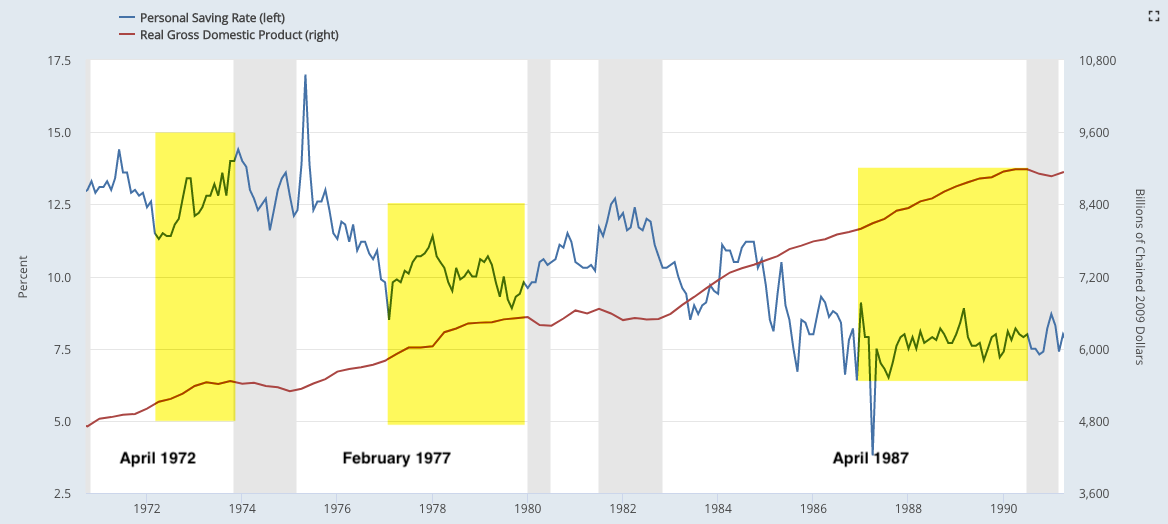
Households' savings rate has fallen in the past two years, potentially bottoming in December. If prior expansionary cycles are a guide, GDP and consumption will continue to expand at least another 18 months even after the savings rate has bottomed and started to rise.

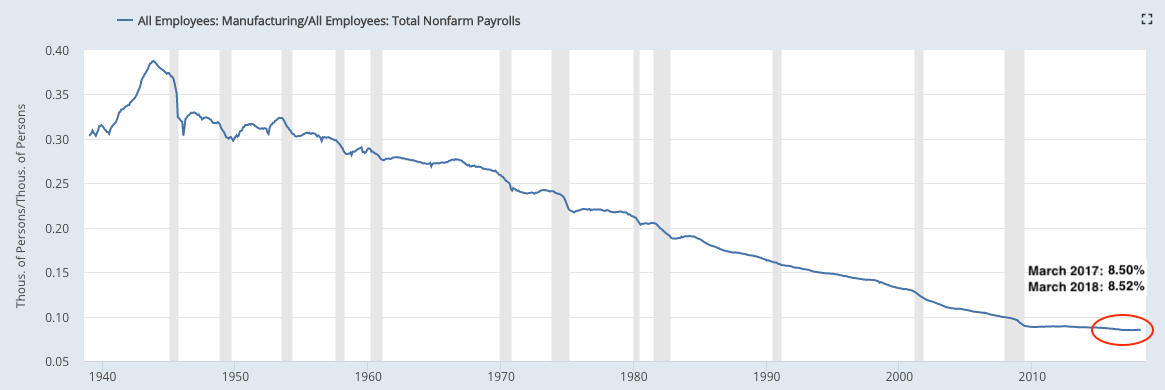
The next several slides look at manufacturing. It's important to note that manufacturing accounts for less than 10% of US employment, so these measures are of lesser importance.
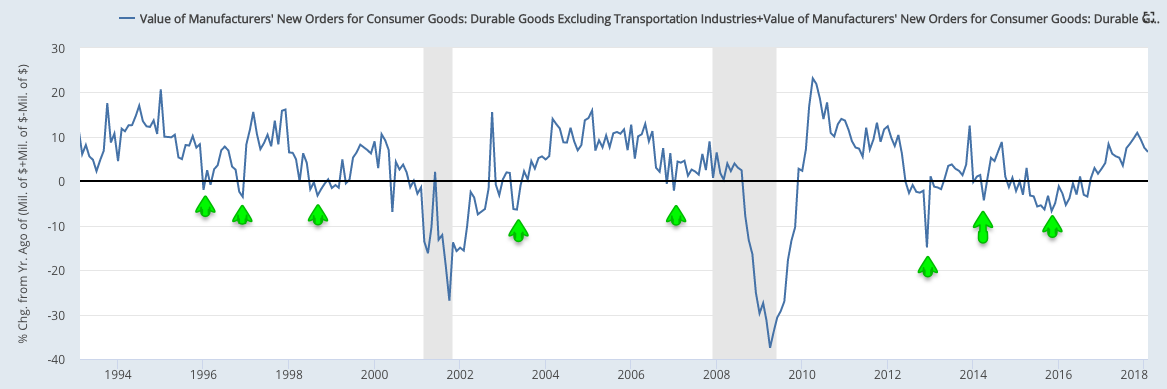
Core durable goods orders (excluding military, so that it measures consumption, and transportation, which is highly volatile) rose 6.6% yoy (nominal) in February, close to the best annual growth rate in 4 years (since December 2013). Weakness in durable goods has not been a useful predictor of broader economic weakness in the past (arrows).
Industrial production (real manufacturing, mining and utility output) growth was 4.4% yoy in February. The more important manufacturing component (excluding mining and oil/gas extraction; red line) rose 2.7% yoy. This is the best growth rate for both in 4 years. Industrial production is a volatile series: manufacturing growth was lower at points in 2014 than it was in 2016 before rebounding strongly.
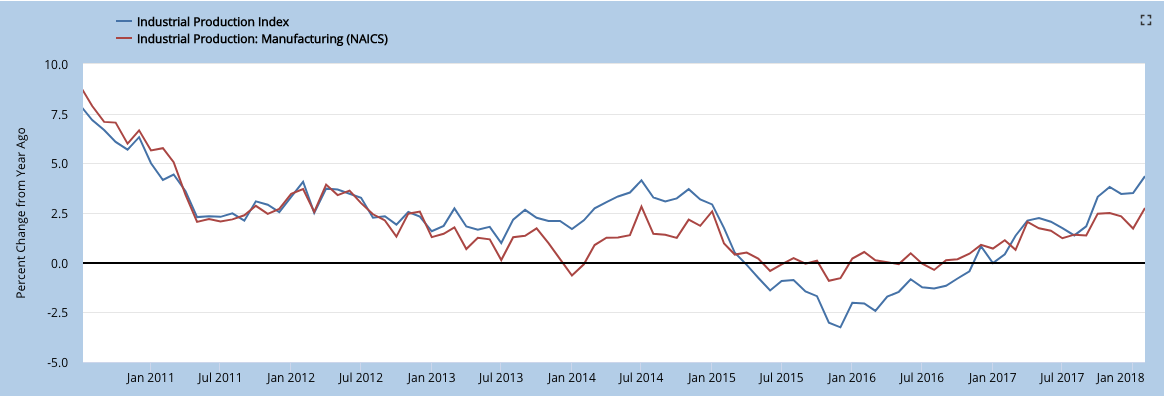
Importantly, about 75% of industrial production groups are expanding. A drop below 40% will imply widespread weakness that typically precedes a recession (from Tim Duy).

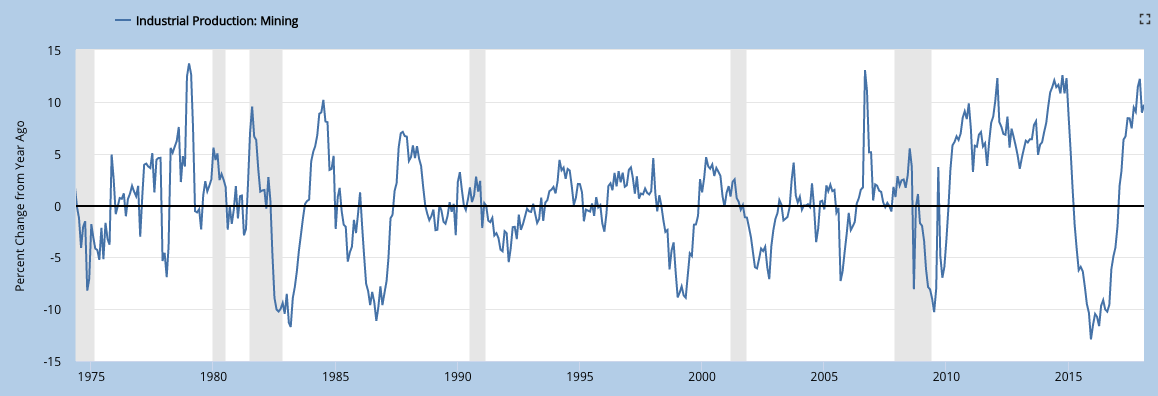
Weakness in total industrial production had been concentrated in the mining sector; the past two years had the worst annual fall in more than 40 years. It is not unusual for this part of industrial production to plummet outside of recessions. With the recovery in oil/gas extraction, mining rose 10% yoy in February.
Housing
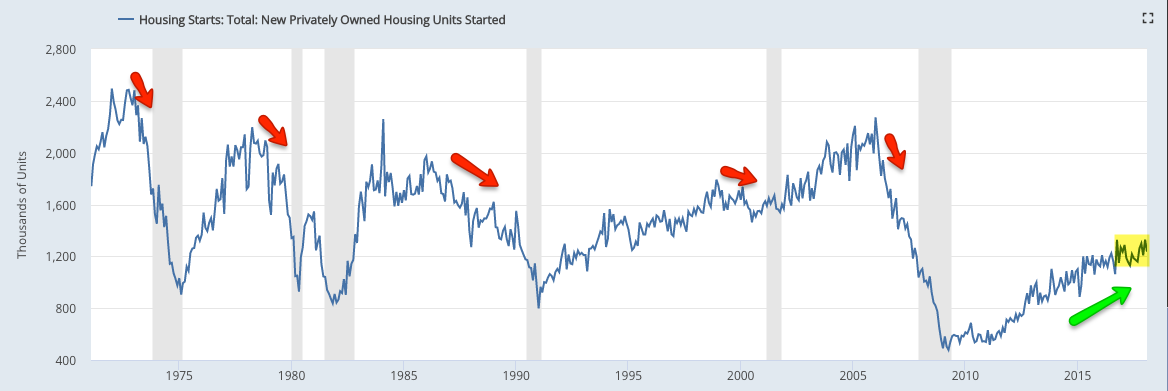
New housing sales fell 1% yoy in January after reaching their highest level in 10 years in November. Housing starts and permits are near a 10 year high although multi-family unit remain relatively weak. Overall levels of construction and sales are small relative to prior bull markets, but the trend is higher.
First, new single family houses sold was 618,000 in February; sales in November were the highest of the past 10 years. Growth in February was 0.5% over the past year after growing +17% yoy in February 2017.
Second, housing starts fell 4% yoy in February after rising 7% yoy in February 2017. Starts in January were at the highest level of the past 10 years.
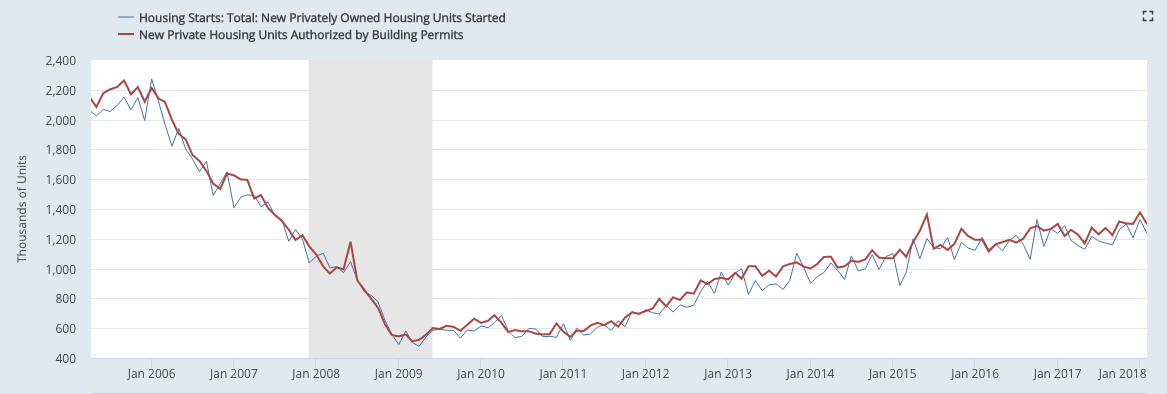
Single family housing starts (blue line) reached a new post-recession high in November and were only marginally lower in February. Meanwhile. multi-unit housing starts (red line) has been flat over the past four years; this has been a drag on overall starts.

Inflation
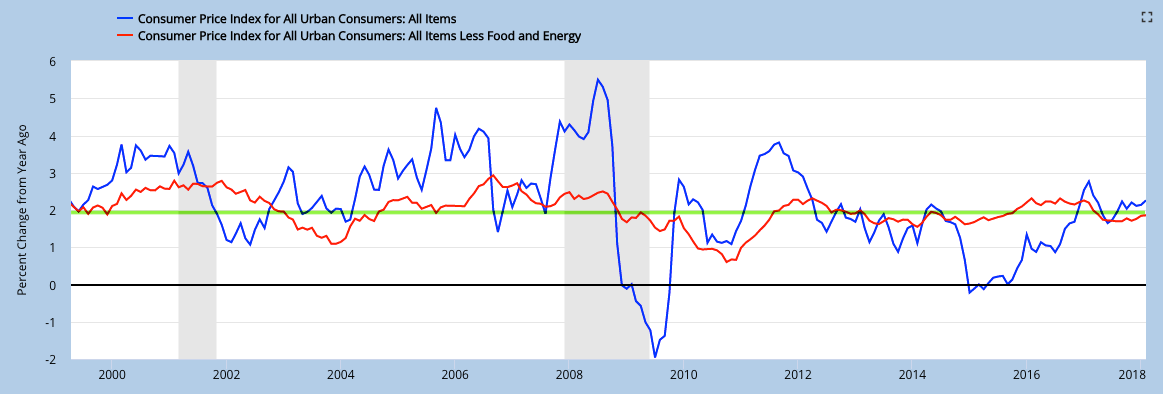
Despite steady employment, demand and housing growth, core inflation remains stuck near (but under) the Fed's target of 2%.
CPI (blue line) was 2.3% last month. The more important core CPI (excluding volatile food and energy; red line) grew 1.9%.
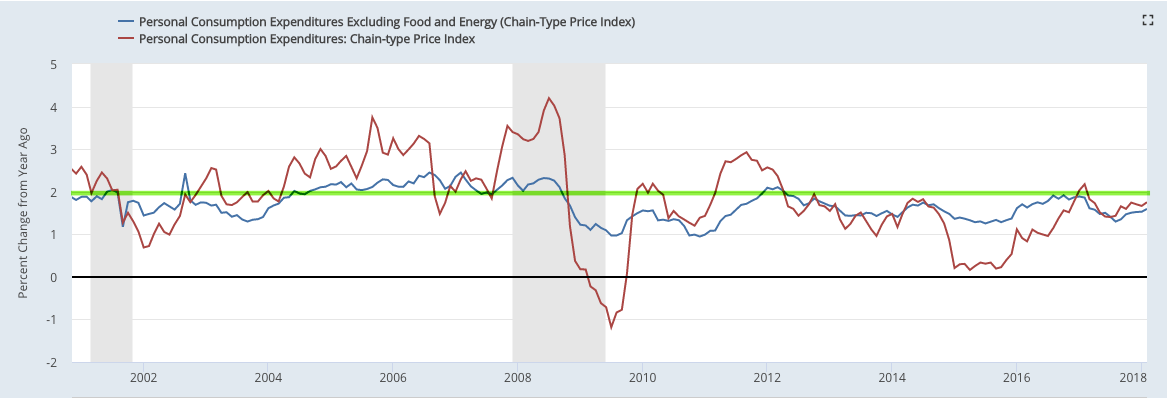
The Fed prefers to use personal consumption expenditures (PCE) to measure inflation; total and core PCE were 1.8% and 1.6% yoy, respectively, last month. February 2017 was the first (and only) month since 2Q 2012 that total PCE was above 2%.
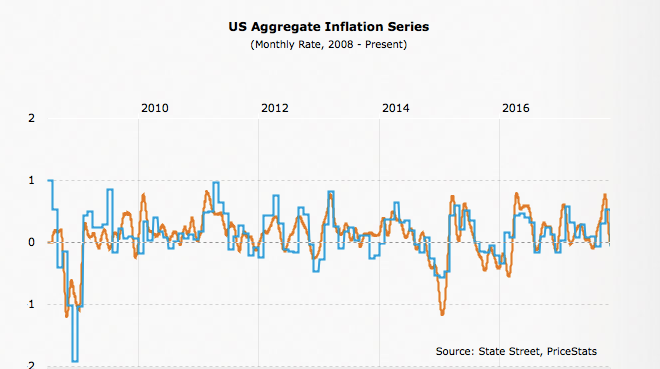
Some mistrust CPI and PCE. MIT publishes an independent price index (called the billion prices index; yellow line). It has tracked both CPI (blue line) and PCE closely.
Summary
In summary, the major macro data so far suggest positive but modest growth. This is consistent with corporate sales growth. SPX sales growth in 2018 is expected to only be about 6-7% (nominal).
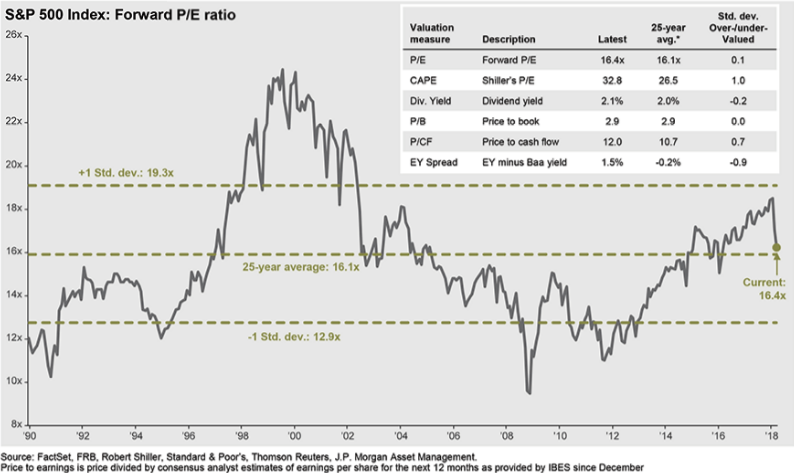
Valuations are back their 25 year average. The consensus expects earnings to grow about 18% in 2018 and 10% in 2019. Equity appreciation can therefore be driven by both corporate growth as well as valuation expansion (chart from JPM).
If you find this post to be valuable, consider visiting a few of our sponsors who have offers that might be relevant to you.