* * *
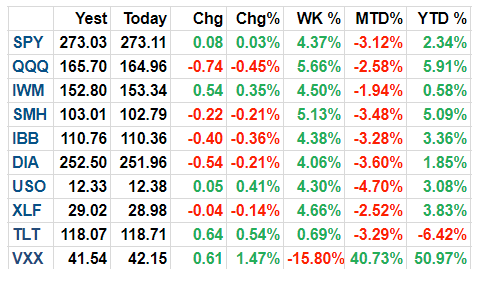
In just one week, US indices regained about half of their losses during the prior two weeks. SPX gained more than 4% and NDX more than 5% (from Alphatrends). Enlarge any chart by clicking on it.
Recall from last week's article that prior falls like the one the markets just suffered has led to quick recoveries, and that likelihood was further supported by a washout in breadth, volatility and several measures of sentiment. Net: risk/reward was heavily biased towards upside in the near term. That post is here.
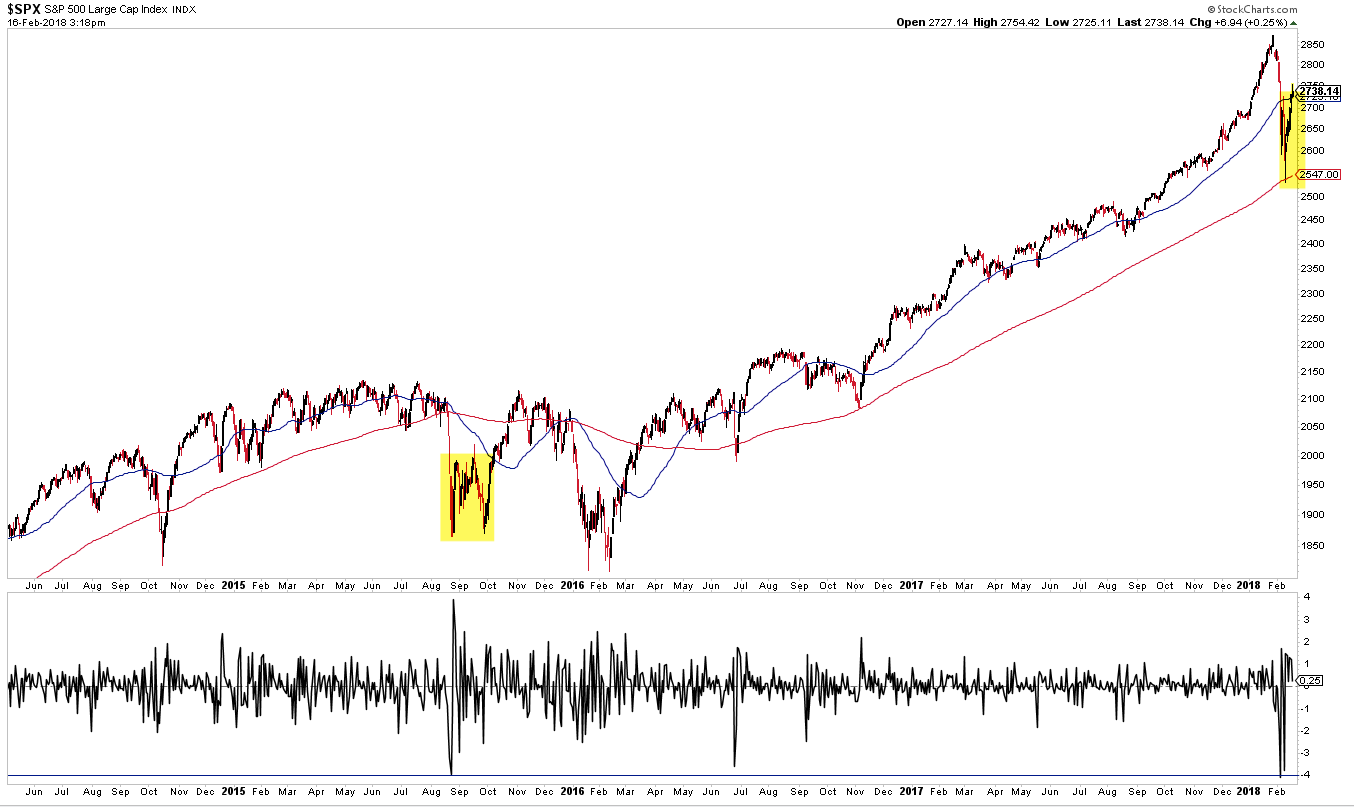
The bounce puts SPX back above its rising 50-dma as well as its rising 13-ema. New uptrends start when price regains the 5-dma, which then flattens and then starts to rise (green line); this occurred last Monday and Tuesday. For the week ahead, the rising 5-dma is an important marker that a new uptrend remains underway (arrows).
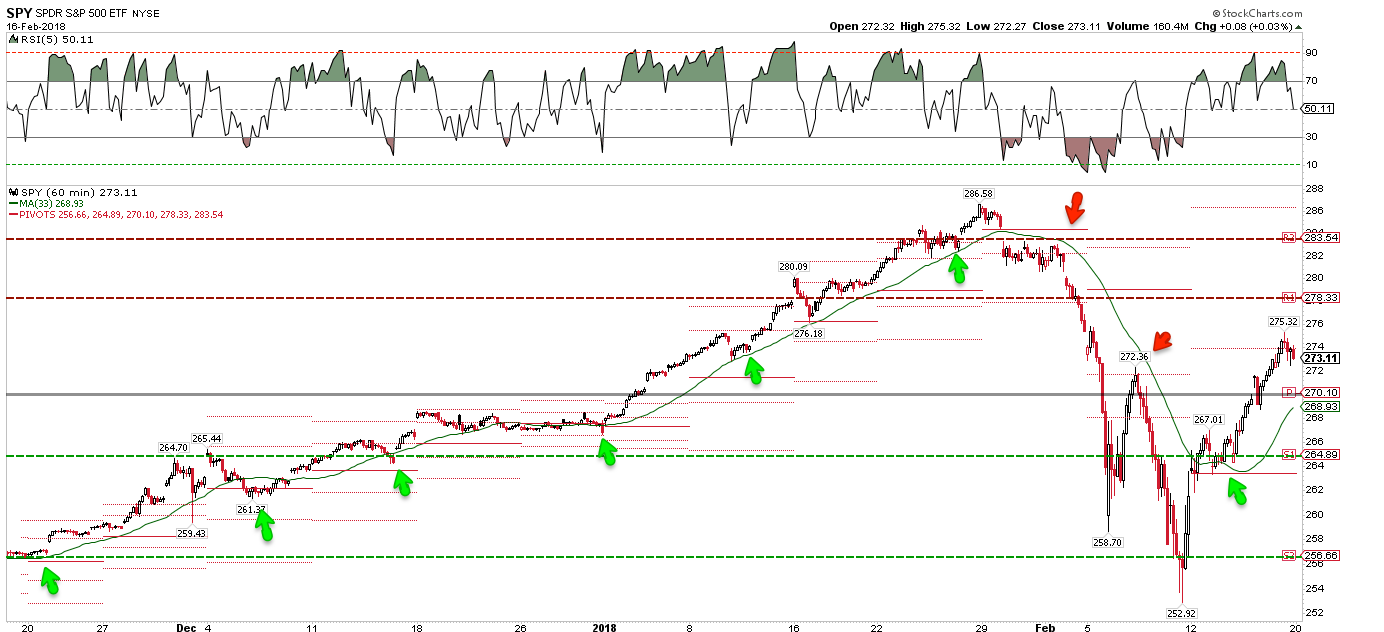
With the VIX still near 20, expect volatility to remain high. Holding the weekly pivot (gray line, above) would be very positive, but a more realistic heavy support level is weekly S1, which was also Wednesday's open (dashed green line).
Many of the studies from last week anticipated the strong rebound, and a few also expected the low to be retested over the weeks ahead. Is that still likely?
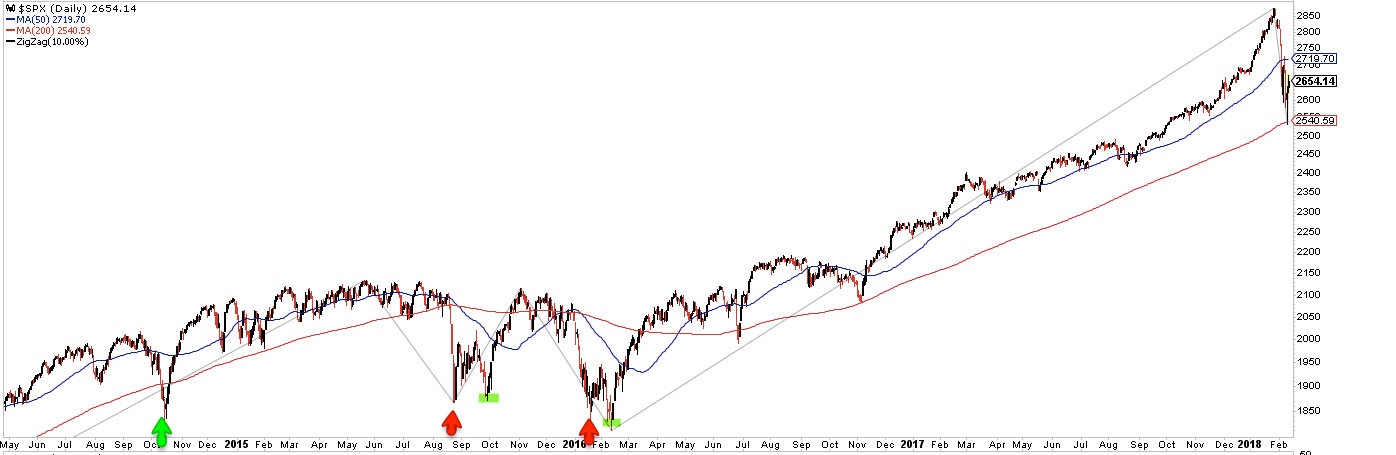
Corrections (i.e., falls of 10%) during bull markets have had a strong propensity to form a double bottom (green shading). Since 1980, only 16% of corrections have had a "V bounce" where the low was never revisited. However, the current bull market has been different: since 2009, about half of the corrections have had a "V bounce" (green arrows). Net, there is at least an even chance that the low will be tested. A new post on this is here.

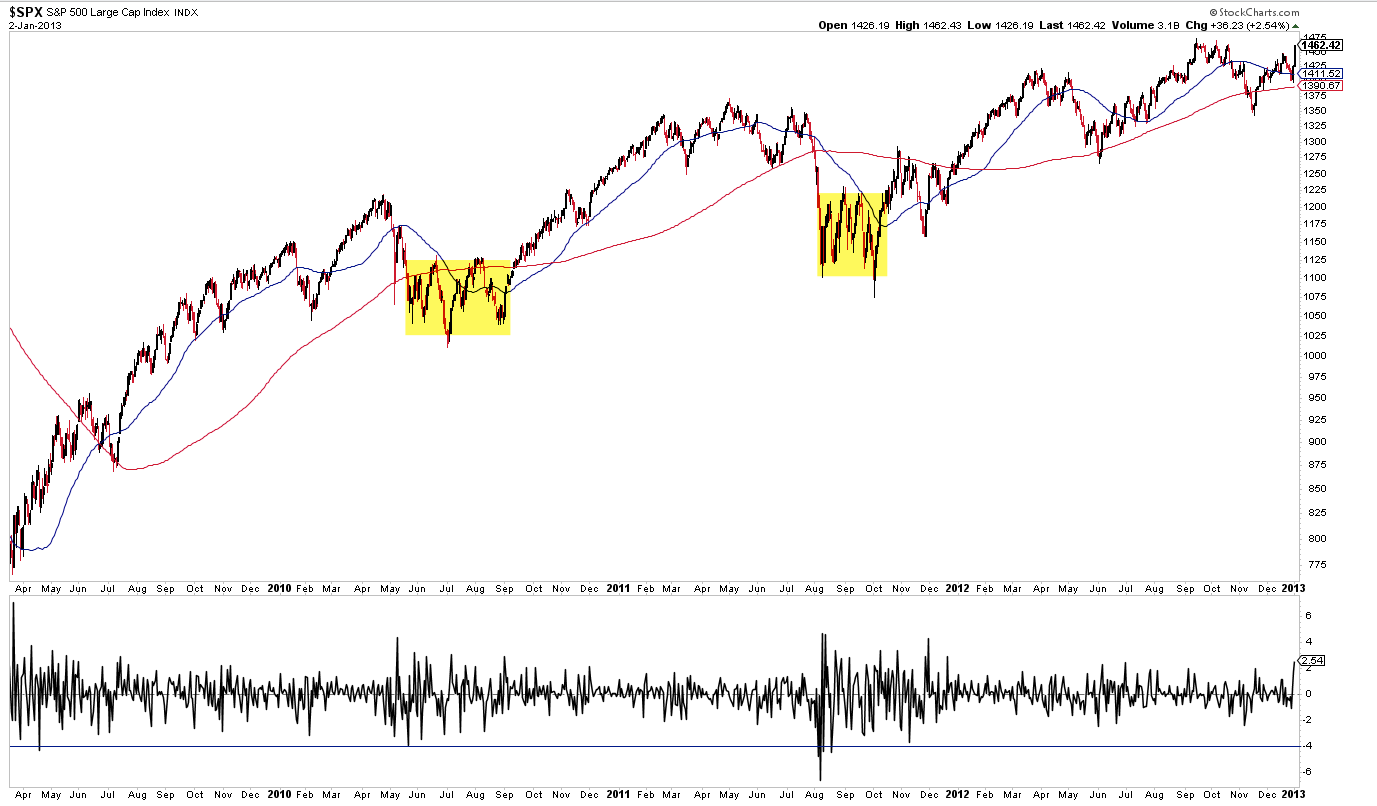
The strong bounce this week doesn't change that perspective. Consider, for example, daily falls of 4%, something SPX experienced on February 5. Since 1980, there have been more than 10 of these while SPX was in an uptrend. Each time, SPX has bounced and then dropped again, usually to the prior low, as shown in the charts below (shading starts with initial >4% drop).
1982

1986

1989-91

1997-2000

2010-11
2015
Technician Tony Caldaro indicated that SPX flashed a WROC buy signal this week (read his post here). Roughly, the buy signal looks for a 3% weekly gain after SPX has become oversold (RSI(5) under 40). The last two signals came right after Brexit and the 2016 US election. The signal's track record is not perfect, but SPX has often begun a sustained uptrend. At a minimum, SPX has closed higher in the coming weeks. But previous buy signals have also come before an eventual low retest (or lower low; in July 2010; July and August 2011; and February and September 2015).

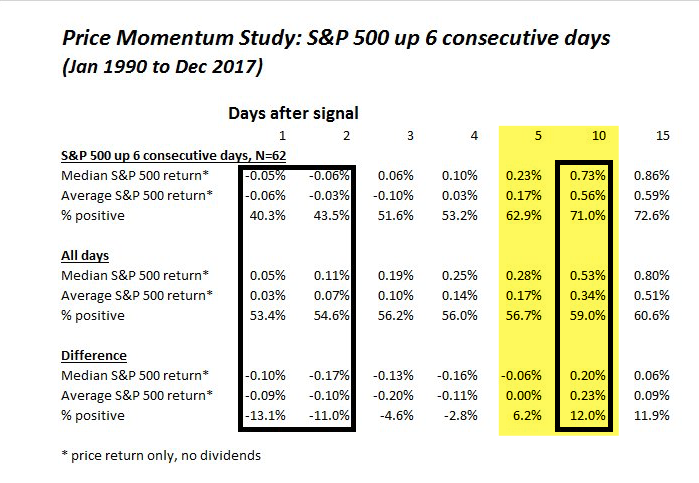
The very short term trend in SPX indicates that further upside is still ahead. SPX has now risen 6 days in a row; in the past 5 years, that has led to at least one higher close within the next 7 days all 12 times. 10 of those instances occurred within the next 5 days. Risk/reward has been more than 3:1 positive over this period. Data back to 1990 shows a pattern of weakness over the next few days followed by relative outperformance 5-10 days later (from Dana Lyons).
Sentiment remains a short term tailwind. The CNN Fear and Greed index dropped to 8 a week ago. Despite the strong bounce, it was still 18 on Friday (from Sentimentrader).

Moreover, volatility remains in backwardation. That doesn't preclude a low retest, but it does suggest that the rebound probably has further to go.

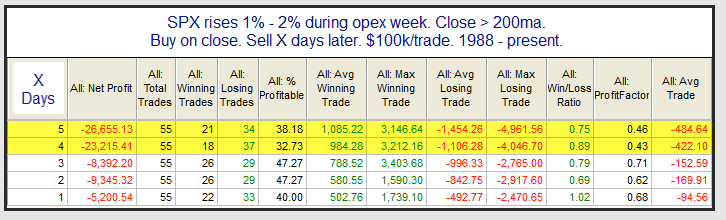
Last week's rally came during Options Expiration (OpX). Strong rallies during OpX have had a tendency to be followed by weakness in the following week (from Quantifiable Edges; his post is here).
In summary, the rebound in US equities has been strong enough and persistent enough to suggest that it has further to run. Sentiment and volatility backwardation support that view. However, a low retest over the coming weeks is still a viable risk.
The macro calendar this is very light this week, with just the FOMC minutes being released on Wednesday.
If you find this post to be valuable, consider visiting a few of our sponsors who have offers that might be relevant to you.