The current bull market has been different. Since 2009, about half of the corrections have had a "V bounce." So what happens this time?
Sentiment can be reset through both time and price. It's a good guess that if price recovers quickly, sentiment will again become very bullish, making a retest of the recent low probable. A slower, choppier recovery will keep investors skeptical, increasing the odds that the index continues higher.
* * *
Our weekend article summarized the outlook for US equities following the first 10% correction since early 2016 (read it here). Prior swift falls of this magnitude have led to quick recoveries that eventually retested prior highs. That view is further supported by the washout in breadth, volatility and several measures of sentiment. Overall, risk/reward appears heavily biased towards upside in the near term. The strong rally today seems to support that view.
But our article also showed that while equities sometimes "V bounce", they more often form a double bottom as the strong down momentum is worked off over time.
This article provides 25 examples of roughly 10% falls in SPX over the past 38 years to demonstrate the strong propensity of the index to form a double bottom. We have not been a slave to the fall being at least 10% and we have deliberately excluded examples from the four bear markets where equities were clearly trending downward.
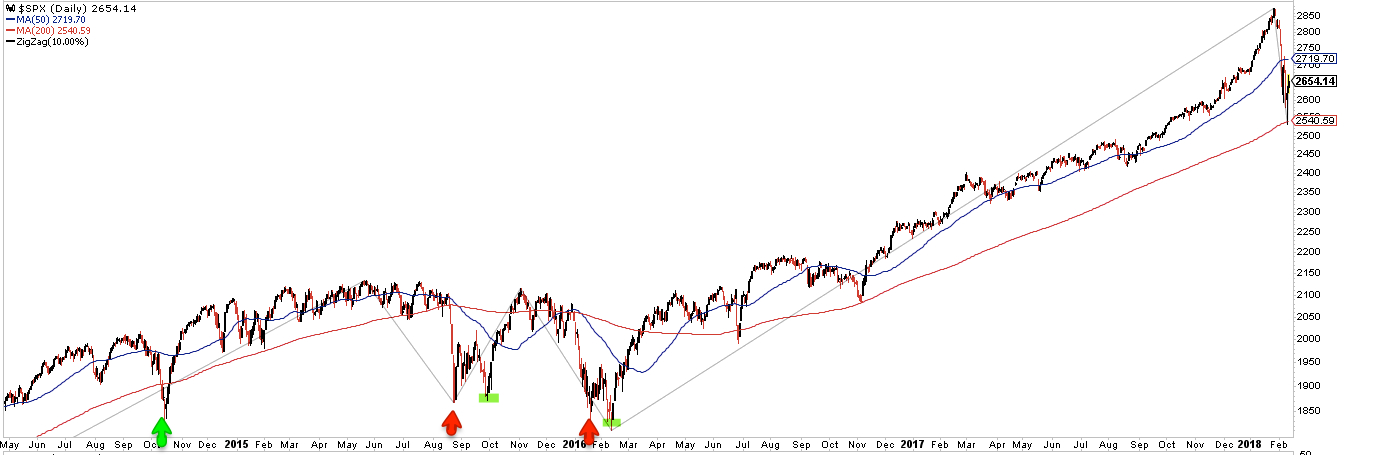
In the charts below, a red arrow is the initial 10% fall and the green highlight is the retest of the low in following weeks. 84% of the corrections have had a low retest (or a lower low).
There are 4 cases (16%) marked with a green arrow showing the initial 10% fall to also essentially be the low (a "V bounce").
While the "V bounce" has been rare, it's notable that 3 of the 4 cases since 1980 have taken place during the current bull market. If you just consider the past 9 years, the odds of a "V bounce" are a coin toss.
So which happens this time?
Sentiment turned very bearish during the past two weeks. It's a good guess that if equities now quickly recover, and if sentiment also quickly becomes very bullish, then a retest of the recent low is probably ahead. A slower, choppier recovery will keep investors skeptical, increasing the odds that the index continues higher. Enlarge any chart below by clicking on it.
1980-84.

1986-90.

1992-94.

1996-98.

1998-2000.

2004-06.

2007.

2009-12.

2014-18
If you find this post to be valuable, consider visiting a few of our sponsors who have offers that might be relevant to you.