There are two watch outs, however, that make 2017 much higher risk than 2013. It's also worth recalling that equities fell 3-8% at six different points in 2013. Expecting 2017 to continue to ride smoothly higher will probably prove to be a mistake.
* * *
2017 is off to a remarkably similar start to 2013. Is it set to be a repeat of that year? It's an important question as stocks gained about 30% in 2013.
Consider some of the following:
2017, like 2013, is the first year in a new Presidential term.
Both years got off to a fast start. By March, SPX had gained 8% in both 2013 and 2017.
Both years started by making a string of new all-time highs (ATHs). By the end of February, the Dow Industrials had closed at a new ATH 12 days in a row. A similarly rare streak of 10 days took place by March 2013.
SPX is often weak in February. But the index gained in both January and February in 2013 and 2017. In the other instances that this has happened since 1945, SPX closed up for the full year every time by an average of 24% (more on this here).
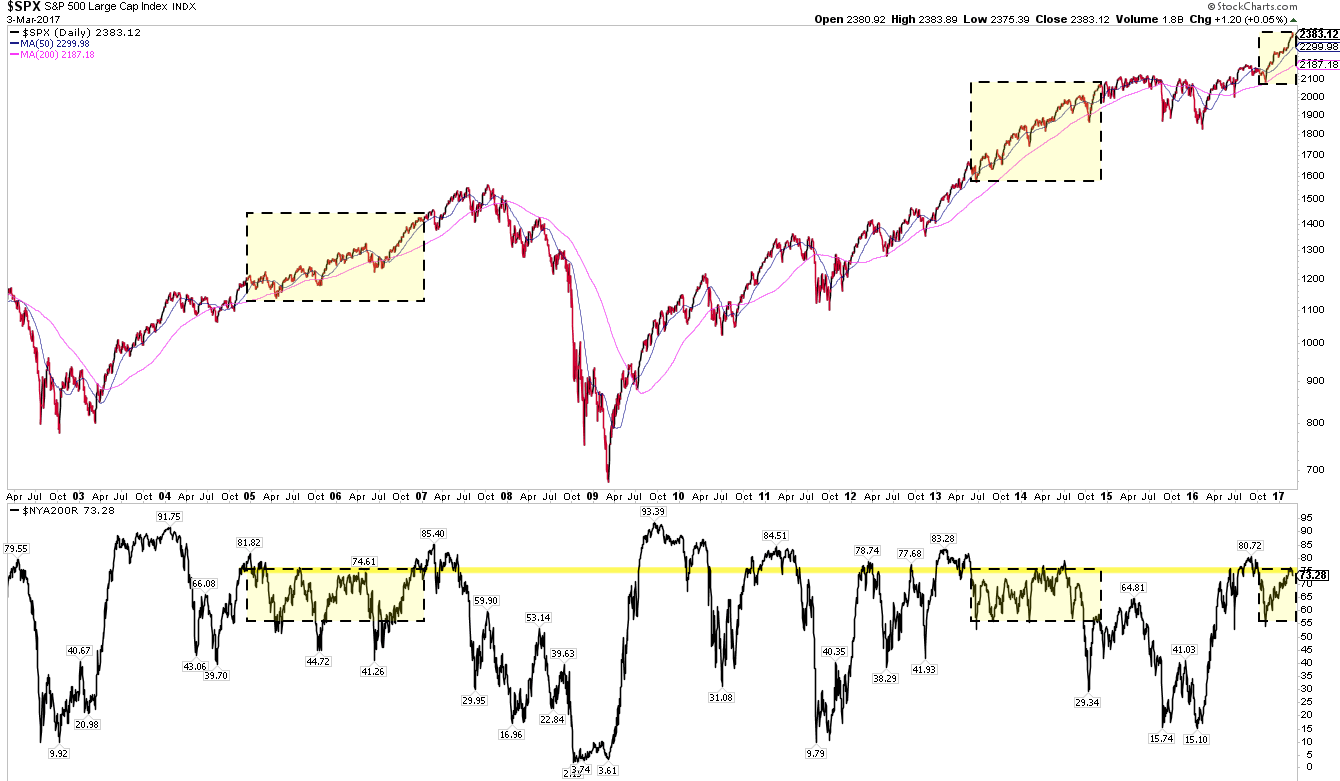
Both 2013 and 2017 came on the heels of long, volatile periods. SPX dropped 20% in 2011 and started 2013 only 2% higher than 18 months earlier. Similarly, SPX dropped 16% in 2016 and started 2017 only 5% higher than 18 months earlier. In both years, a dip at the election in November caused the market to be oversold; in both years, the market was significantly overbought by March (top panel).
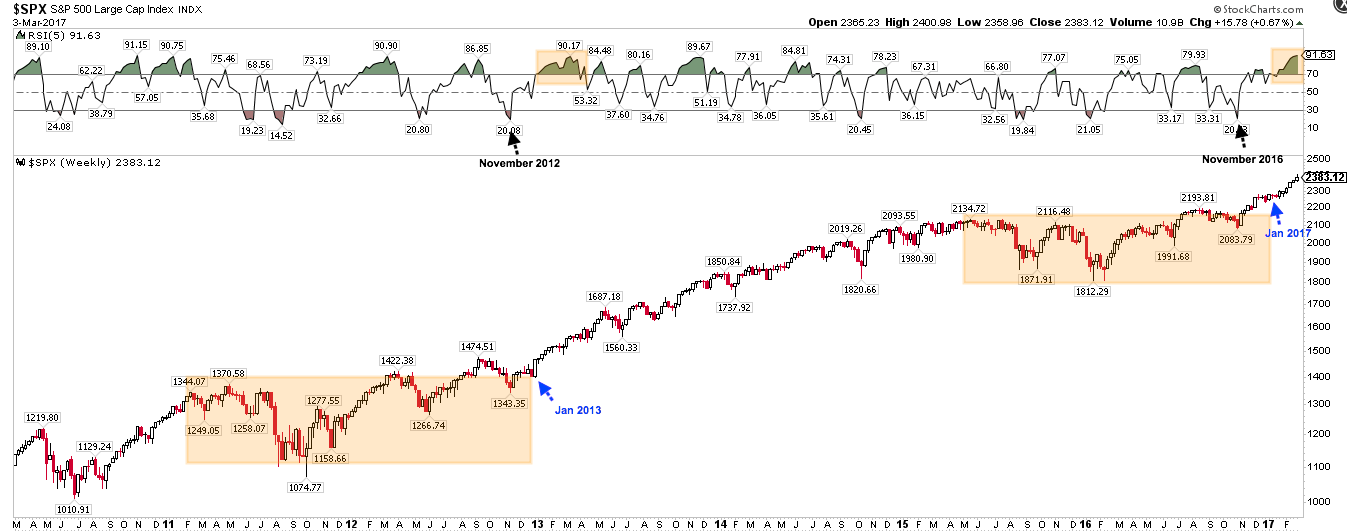
That persistent, unrelenting strength in price caused volatility to collapse in both years. Vix started 2013 at 15 and fell to 11 by mid-March. This year, Vix started the year at 14 and closed at 11 on Friday.
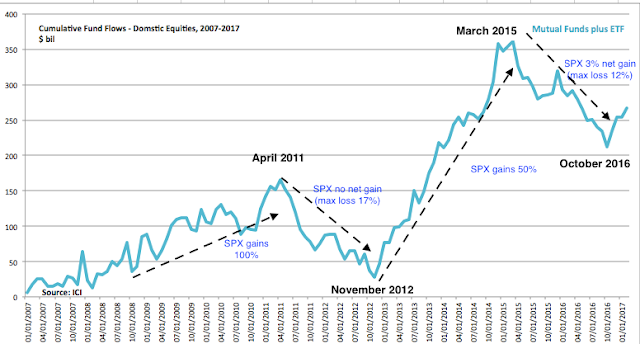
Perhaps most importantly, both years were driven higher by a persistent inflow of money into equity ETFs and mutual funds. In both years, fund flows had been consistently negative for a year and a half prior to the election, then strongly rebounded. These strong inflows correlate with periods of strong performance for the equity indices (from ICI).

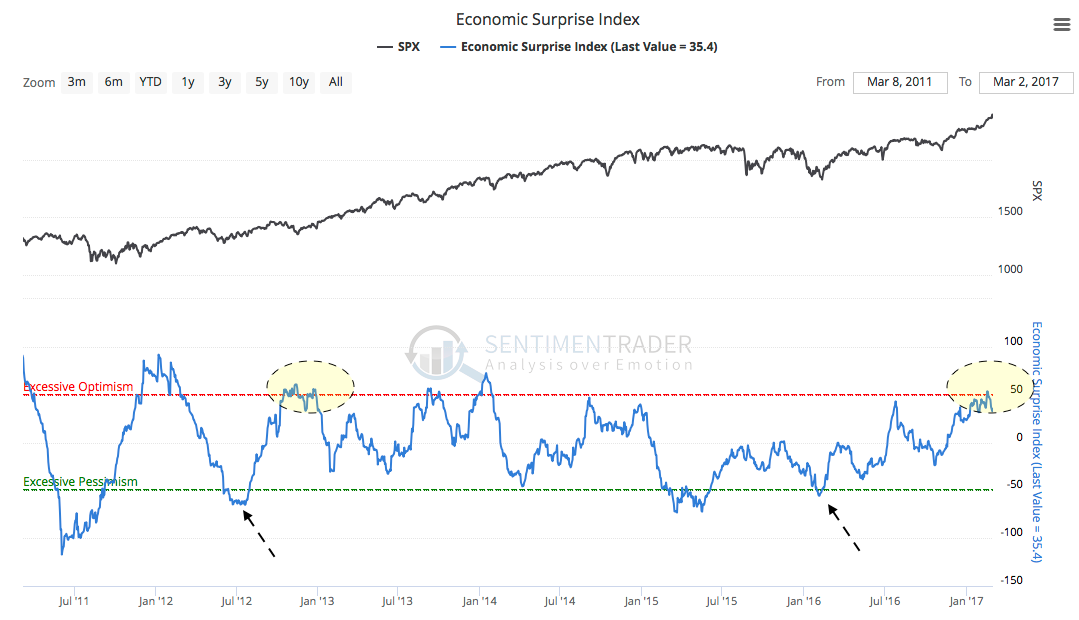
Economic data was strong and ahead of expectations at the start of both 2013 and 2017 (ovals). In both cases, this rebound in optimism came after a period of economic pessimism (arrows).
That rebound in economic optimism can also be seen in inflation expectations. In both early 2013 and 2017, inflation expectations had risen 60 bp over the prior 6 months to a 2 year high.

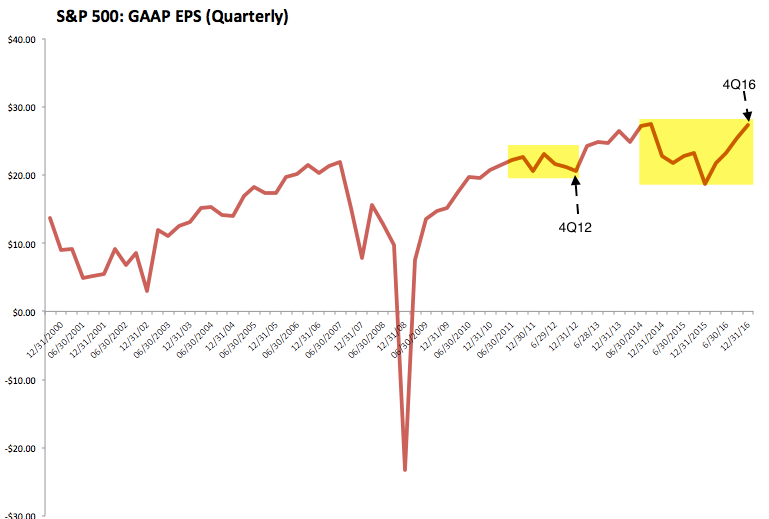
In both years, earnings were exiting a period without any growth. Over the 18 months prior to the start of 2013, GAAP EPS had declined a net 7%. Over the 18 months prior to the start of 2017, EPS was dead flat. One difference between these years is that in early 2013, EPS had yet to show any rebound in growth; in 2017, EPS is already a year into a strong rebound (from S&P).
Finally, breadth in the equity markets is similar in both 2013 and 2017. About 73% of stocks on the NYSE are currently above their 200-dma; for most of the 2013-14 rally, breadth was actually lower than now. That was also the case in during the 2005-07 rally in equities (lower panel).
So, in many ways, both technical and fundamental, the current period looks remarkably similar to 2013. That could turn out to be a good omen for equities. But there are two very important differences between these years.
The most important is short term measures of investor sentiment are more elevated now than they were in 2013. To take one example, the Investors Intelligence survey currently shows nearly 50 percentage points more bulls than bears; at this point in 2013, it was only about 30 percentage points and would not reach 50 percentage points for a full year. Readings near 50 have previously corresponded to weak performance in SPX over the following weeks (shading).

Similarly, the Daily Sentiment Index (DSI) exceeded 90 for the first time since late 2013 this past week. This is an exceedingly rare level of bullishness; similar readings over 90 in February 2011, May 2013 and November 2013 corresponded with drops in SPX of 7%, 8% and 3% in the ensuing weeks. Again, it took until May in 2013 before sentiment reached current levels (from Gavin Parks).

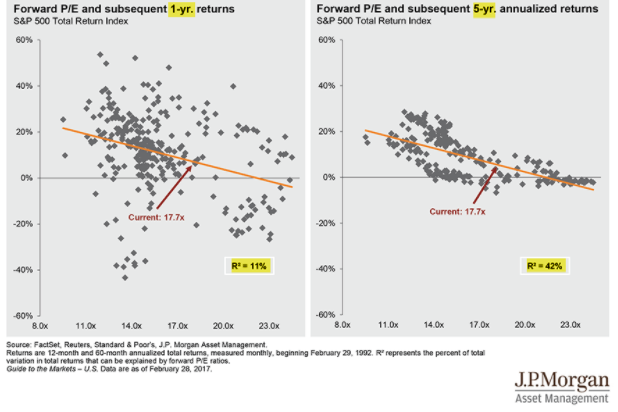
The other significant difference between now and 2013 is valuation. Forward Price/Earnings was less than 13x at this point in 2013; it is now nearing 18x (from Yardeni).

Valuation has almost no correlation to returns over the next year (left chart), but high valuation does imply lower returns beyond that (right chart). Equities can appreciate faster than earnings when valuations are below average; when they are above average, returns are eventually limited by the growth rate in corporate profits. When that will happen - now, next year or 3 years from now - has historically been anyone's guess (from JPM).
Given the persistent strength of the current uptrend, an important final point is this: while SPX gained more than 30% in 2013, it did not get there in a straight line. It fell 3-8% at six different points during the year, usually every other month. While Vix was low in March, like it is now, Vix shot to 17-20 multiple times during the year. Expecting 2017 to continue to ride smoothly higher will probably prove to be a mistake.

In summary, 2017 is off to a remarkably similar start to 2013. No two years are ever exactly the same, so there's no reason to suggest that 2017 will repeat the 30% gains achieved in 2013. But many of the technical and fundamental similarities between these years suggest that 2017 may continue to be a good year. There are two watch outs, however, that make 2017 much higher risk than 2013. It's also worth recalling that equities fell 3-8% at six different points in 2013. Expecting 2017 to continue to ride smoothly higher will probably prove to be a mistake.
The calendar is light for the week ahead. NFP will be released on Friday.