The critics were wrong because they confused a collapse in one sector - energy, where sales dropped by 60% - with a general decline in all sectors. But in the past two years, sales in the other sectors have continued to grow and margins have mostly remained strong. A rebound in oil prices (and only modest appreciation of the dollar, another headwind in the past two years) bodes well for forward sales and earnings growth.
Where critics have a valid point is valuation: even excluding energy, the S&P is now more highly valued than anytime outside of the 1998-2002 dot com bubble. Valuations rise with investor sentiment; that sentiment is now very bullish. With economic growth of 4-5% (nominal), it will likely take outright exuberance among investors to propel S&P price appreciation at a significantly faster rate.
* * *
A year ago, profits for companies in the S&P had declined 15% year over year (yoy). Sales were 3% lower. Margins had fallen more than 100 basis points. The consensus believed all of this signaled the start of a recession in the US.
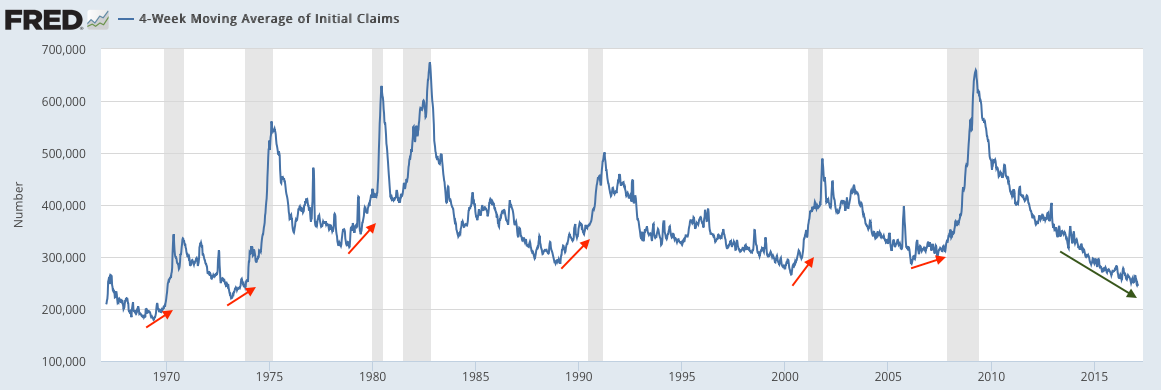
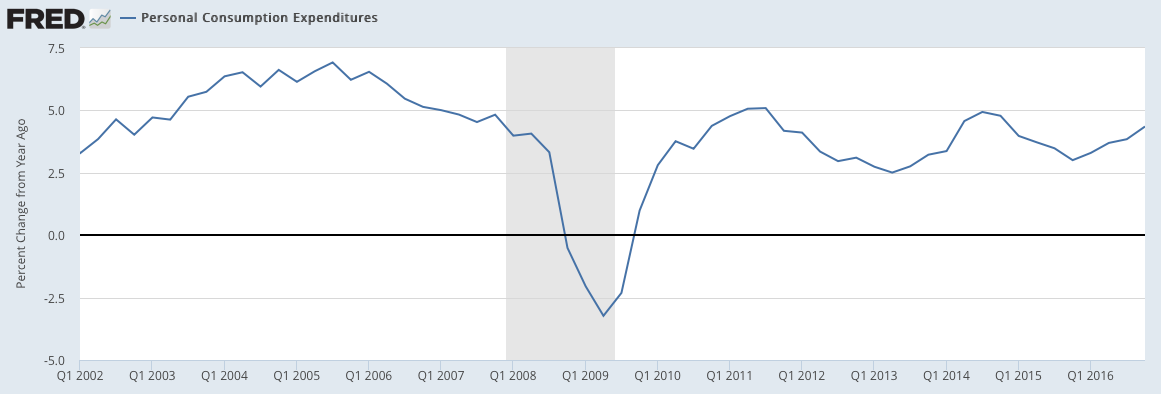
These dire prognoses for the US have not worked out. Jobless claims are at more than a 40 year low (first chart below) and retail sales are at an all-time high. US demand growth, measured a number of different ways, has been about 4-5% nominal yoy during the past two years (second chart below). There has been no marked deterioration in domestic consumption or employment.
The resilience of the US economy in the face of deteriorating sales and profits is not a surprise. We wrote about this a year ago, saying that there was little in corporate reports to suggest that a recession was imminent (that post is here). Events since then bear this analysis out (as summarized here).
Let's review the latest corporate reports. More than 80% of the S&P 500 has reported their sales and earnings for 4Q16.
Overall sales are 4.5% higher than a year ago. This is the best sales growth since 3Q14 - more than 2 year ago. On a trailing 12-month basis (TTM), sales are 2.1% higher yoy (all financial data in this post is from S&P).
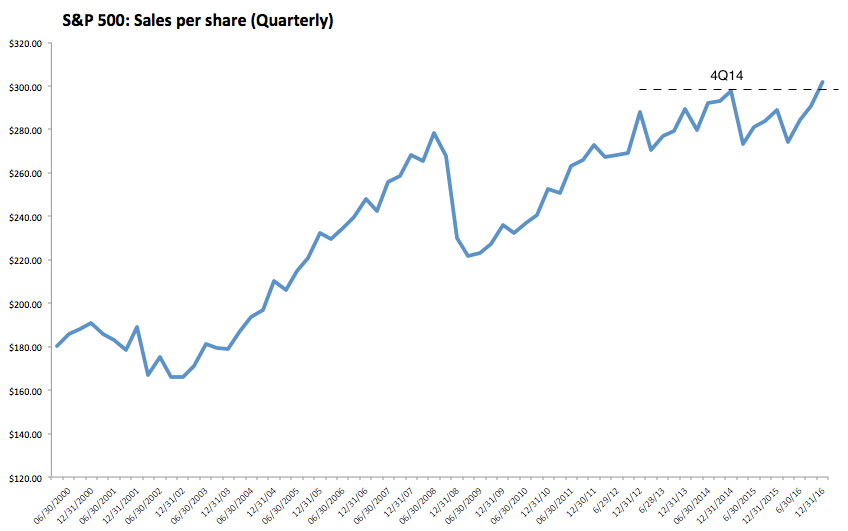
In the chart above, note that overall S&P sales are at a new high, having finally exceeded the prior peak from 4Q14.
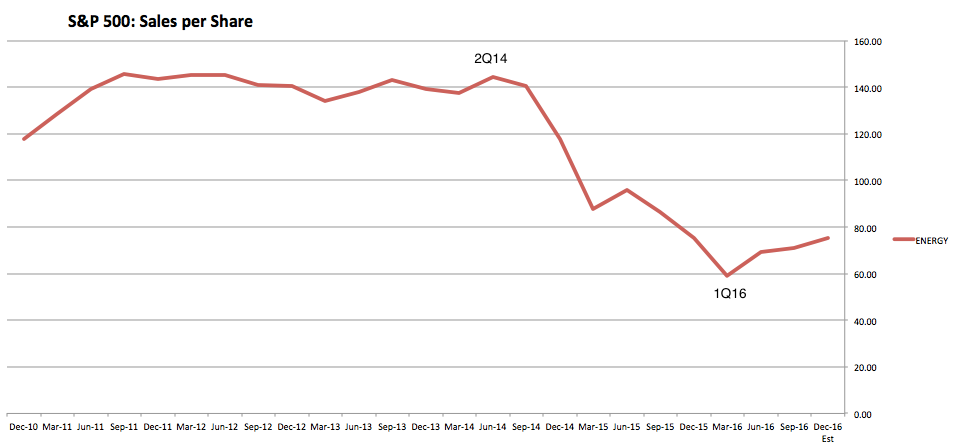
Recall that oil prices peaked at the end of 2Q14 and then fell 70% before bottoming in February 2016. Energy sector sales fell by 60% between mid-2014 and early 2016 (red line). This had a substantial impact on overall sales, as energy was one of the largest sectors in the S&P in mid-2014. Since then, energy sales have rebounded by 27%, helping lift overall S&P sales.
If overall S&P sales since 2014 were indicating widespread economic weakness, then we should have seen declining sales growth in many sectors, not just in energy. We didn't. In the past two years, industrial sector sales are up 6%, discretionary sales are up 16%, health care sales are up 16% and financials sales are up 21%. Outside of energy and materials, only utilities have seen a decline, a loss of just 4% (middle column).
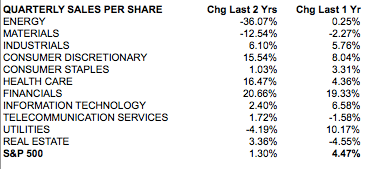
Simply stated: corporate sales have not indicated weakness in the economy.

Non-energy sales growth has been sluggish because companies in the S&P derive about half of their sales from outside of the US. Technology and materials are the sectors most dependent on foreign sales, but even 40% of staples sales come from overseas.
Europe and Asia are the main markets outside of the US. Real European GDP is growing at around 1.8%. Japan's real GDP grew 1.7% in 4Q16. That's slower growth than the US, but not dramatically so. Importantly, ex-US growth is better now than it was 2-3 years ago.

But a headwind for ex-US sales growth has been the value of those transactions measured in dollars. When the dollar rises in value, the value of sales earned abroad (in foreign currency) falls. If foreign sales grow 5% but the dollar gains 5% against other currencies, then sales growth will be zero in dollar terms.
That has been a well-established pattern for more than 30 years. The chart below compares changes in the dollar (blue line; inverted) with growth in S&P sales (red line). A higher dollar has corresponded with lower sales. Overtime, the importance of the dollar's value has grown as the proportion of S&P sales outside of the US has risen (from Yardeni).

The trade-weighted dollar began to rapidly appreciate in July 2014 (3Q14) just as sales on the S&P peaked. By the beginning of 2016, the dollar had appreciated by 25%. With half of the sales of the S&P coming from outside the US, the dollar's appreciation alone cut S&P sales by more than 10 percentage points. In the chart above, you can see that a similar fall in sales growth occurred in 1997-98 when the dollar also rapidly appreciated over the course of a year (shared ovals).
It's not well remembered now, but the heart of the 1990s bull market had an earnings recession that lasted for the better part of 1996-98. It dissipated after the affects of the dollar's appreciation had passed. That seems to have occurred now as well.

Importantly, the headwind from the dollar has largely dissipated. In 4Q16, the dollar's appreciation was only about 5% yoy. In 1Q17, the dollar is tracking an appreciation of less than 3% yoy.

In summary, the sales growth for the S&P was 4.5% yoy in 4Q16. Looking ahead, the average price of oil was about $35 in 4Q15 versus the current price of $50. It's likely that energy will now contribute positively to overall S&P sales growth.

Let's now look at earnings. Overall EPS (GAAP-basis) are 46% higher than a year ago. On a trailing 12-month basis (TTM), EPS is 13% higher yoy. Recall that TTM EPS growth was negative seven quarters in a row from 1Q15 to 3Q16.

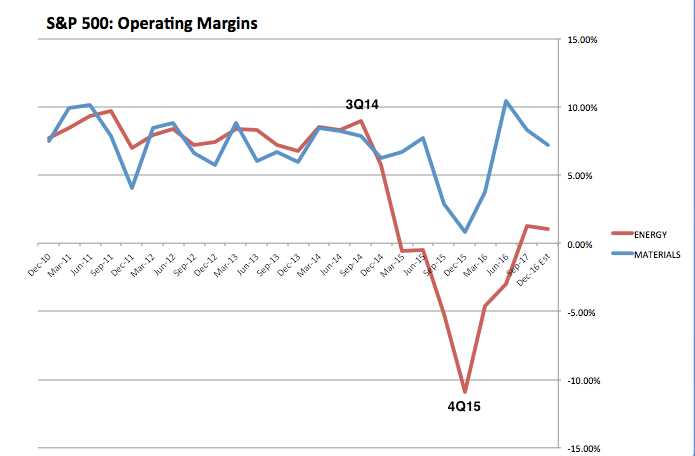
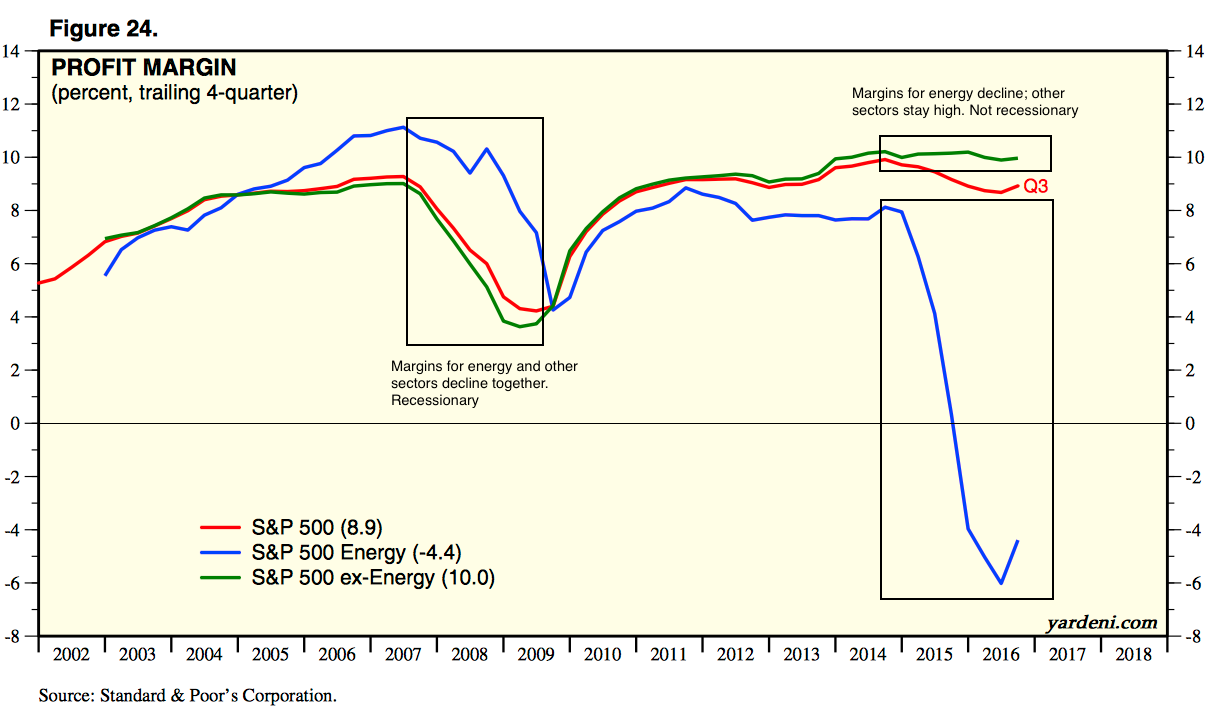
Given the forgoing discussion on sales growth, it should come as no surprise that corporate profitability peaked right before the rapid fall in energy prices and the appreciation in the dollar. In 3Q14, profit margins were 10.1%; that fell to a low of 8% in 4Q15.

In the chart above, note that margins have now rebounded to 9.6%. Overall profit margins are right back near their prior highs from 2014.
For most sectors, margins expanded between 4Q14 and 4Q16 (middle column). The big outlier was energy. Energy had an outsized affect on overall margins and falsely indicated a high risk of recession. (Note: the real estate sector weighing is tiny, at less than 1%).
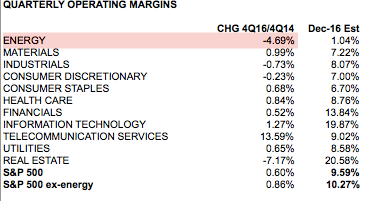
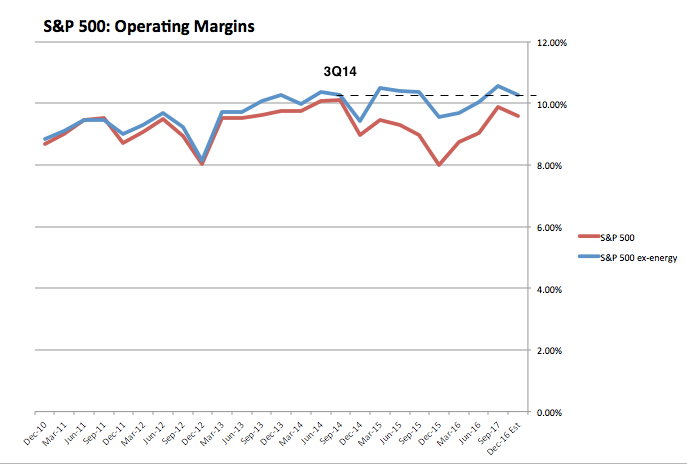
Without the negative drag from energy, total margins for the S&P (blue line) are now as high (10.3%) as they were in 3Q14.
In summary, the EPS growth for the S&P rebounded to 46% yoy growth in 4Q16. Overall profit margins are back at their former highs from 2014. Nearly all of the interim weakness in profitability was related to weakness in energy. That the other sectors showed continued strength was a very strong indication that corporate results were not indicative of an imminent recession (from Yardeni).
Weakness in energy has been a very clear outlier. The point of excluding energy isn't to imply that actual S&P results are better than they are. By excluding energy companies' financial results, we can see what the underlying trend for the rest of the S&P is.
Over the past two years, there have been several knocks on the practice of excluding energy from the other sectors. Most of these miss a basic truth: that in the past, large drops in energy sales and profits have falsely signaled economic risks that did not then materialize. We detailed all of these issues in the past (here). Below is a quick recap:
Excluding energy is not "like excluding technology in 2000 or financials in 2007". Technology and financial stocks were in a bubble in 2000 and 2007, respectively; their market capitalization weighting in the S&P reached an extreme ahead of both of the subsequent bear markets. That was not at all the case for energy in 2014.
The environment since 2014 is nothing like 2006-07 because financial excesses in the banking sector are completely unlike excesses in energy or any other sector. Banks that are excessively leveraged are at risk of failure; when they retrench, lending to the rest of the economy is reduced, creating a drop in investment and consumption and a recession. Banks are a source of systemic risk; other sectors are not.
Lower gas prices do not materially impact other consumer spending. Gas represents only 5% of a typical family's consumer spending.
Lower oil prices don't have a notable positive impact on margins for most of the other large sectors. The importance of oil as an input cost is too minor. Note that most facility energy is produced using coal, natural gas, nuclear power and renewables, not oil.That the drop in energy since 2014 once again has not resulted in an economic recession shows that excluding energy in an analysis of sales and profits is the right approach.
Let's also update two other misconceptions about earnings.
The first is that corporate buybacks have been the main source of profit growth. This is false; almost 90% of the growth in earnings in the S&P since 2010 has come from better profits, not share reductions. This is a topic we have specifically addressed before (most recently here).

The second misconception is that "operating earnings" have abnormally deviated from earnings based on GAAP in recent quarters. It is true that earnings are both overstated and smoothed on an operating basis, but that has been the case over several decades. This is not new.
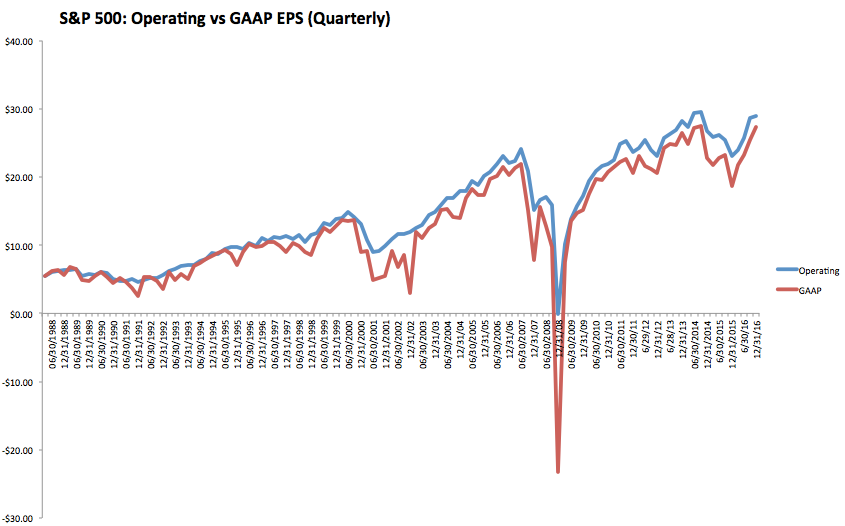
The difference between operating and GAAP earnings is now about 6%, which is well below the median of 10% over the past 25 years. Operating earnings overstated profits by much more in the 1990s bull market and earlier in the current bull market. The biggest differences have always been during bear markets.

Where critics have a valid point is valuation. Even excluding the troubled energy sector, valuations were rich at the end of 2014 and are even more so today. These valuations are higher than in mid-2007 when the prior bull market ended (from Yardeni).

With economic growth of 4-5% (nominal), it will likely take exuberance among investors to propel S&P price appreciation at a significantly faster annual clip. Why? When investors become bullish (blue line), valuations rise (red line). Investors had been pessimistic a year ago; they are now very optimistic. If oil prices and the dollar stabilize, earnings growth may be only 5% TTM yoy but valuations could still push the equity market higher (from Yardeni).

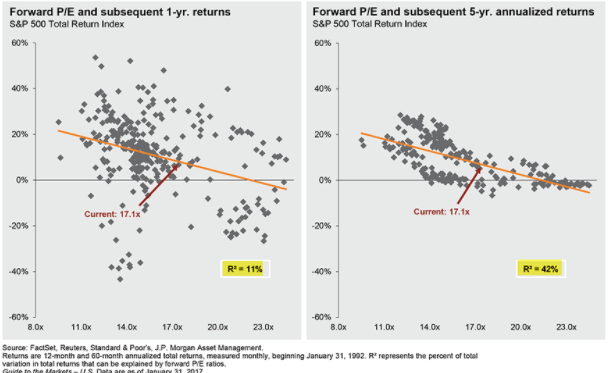
Importantly, valuations have almost no bearing on the market's 1-year forward return (left side). But over the longer term, current valuations suggest that single digit annual returns are likely (right side; from JP Morgan).
If you find this post to be valuable, consider visiting a few of our sponsors who have offers that might be relevant to you.