* * *
This week, the major US equity indices - SPX, NDX and COMPQ - all traded at new bull market highs. Moreover, RUT has traded at a new 12-month high. None of these, nor the DJIA, has closed below its 50-dma since late June. All are trading above their rising 5, 10, 20 and 50-dmas. The trend for US equities remains higher, even on a very short term basis.
As always, the first sign of a weakening trend will be consecutive closes below the 5-dma, which will then flatten or inflect downwards. As of today, that is not the case for any of the US equity indices.
In our last update, we shared several studies related to trend, breadth, sentiment, macro and corporate reports that supported higher equity prices in the month(s) ahead. That continues to be the case. Read that post here.
But there were also reasons to be on alert for a retracement of recent gains in August. This post elaborates further on some of these reasons with a focus on volatility.
The CBOE volatility index, Vix, which measures implied volatility in the stock market over the next month, has been under 12 the last 4 days and also intermittently under 12 over the past month. This is unusually low volatility.
On its own, a very low Vix is not necessarily bearish: forward returns in the SPX are no different than when the Vix is above its median of 18.6 (data from Mark Hulbert).
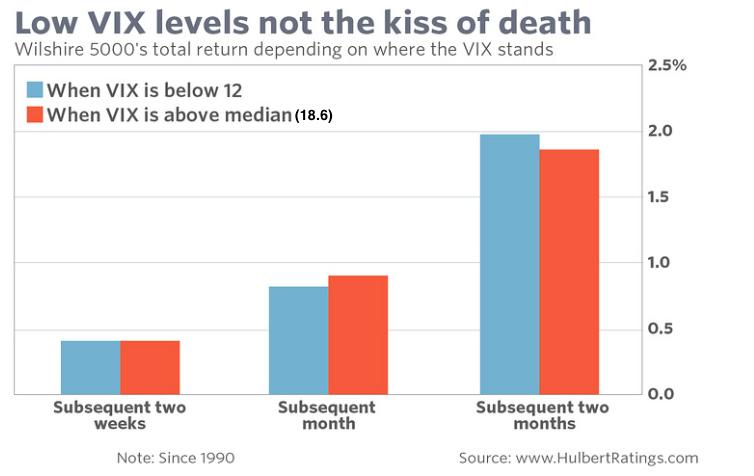
That is not to say that the SPX will necessarily rise. A low Vix can correspond with a short term top in SPX, too. But the relationship is too inconsistent to be a useful bearish predictor on its own. Note in the charts below that Vix can stay persistently very low while SPX continues to rise. A pop higher in Vix is inevitable, but timing that pop can be problematic. Vix was persistently very low for half a year at the end of 2006 and into 2007, for example.


The low Vix now corresponds with an unusually tight trading range in SPX. The 20-day Bollinger Bands on SPX have not been this tight since September 2014. In the next month, SPX dropped about 8%. Similar cases have also preceded large drops in SPX greater than 5% (red arrows). But, again, the relationship is inconsistent: tight Bollinger Bands have also resolved with minor drops in SPX (under 2%) and preceded a significant move higher over the following months (green arrows).
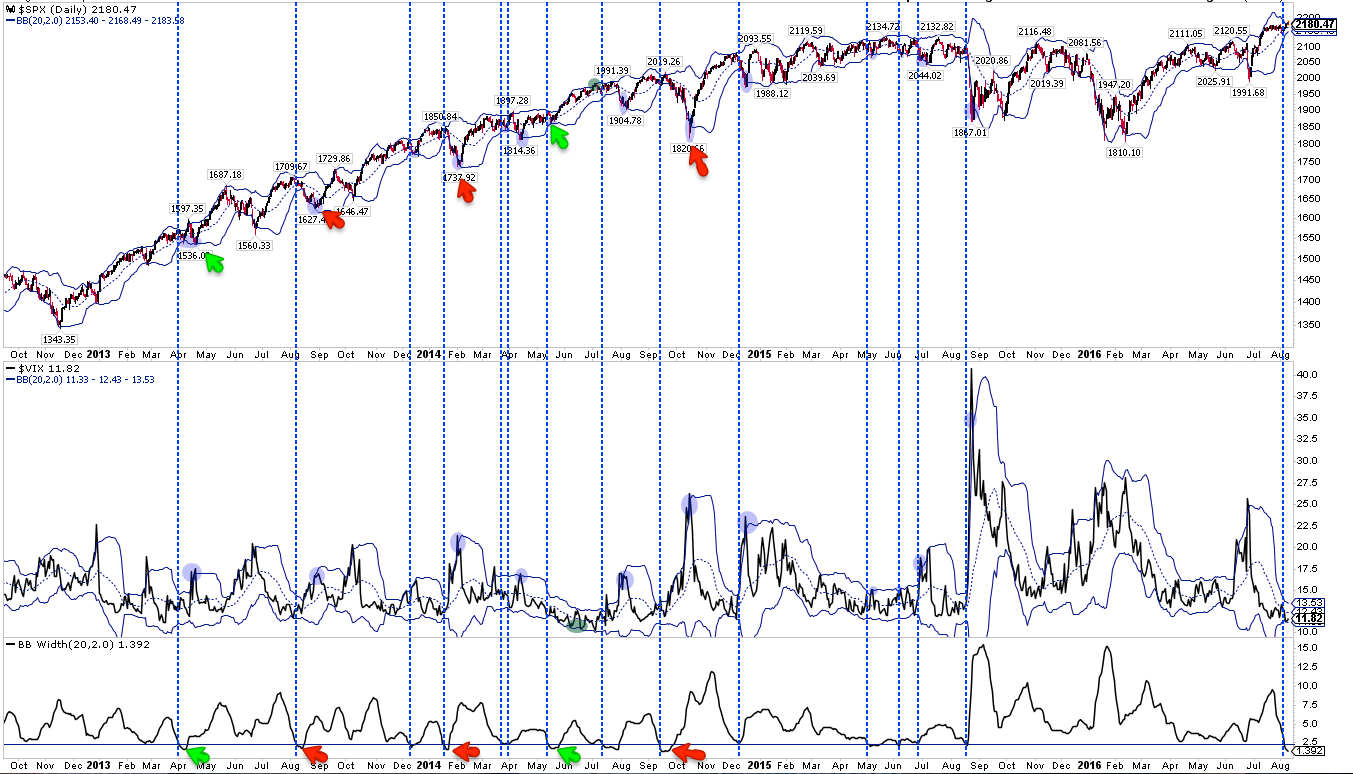
August can be a quiet month for trading. In the past few days, the full-day volume in SPY has been lower than on the half-day of Christmas Eve.
So its interesting that in each of the past 7 years, Vix has popped higher in August at some point (lower panel). That pop typically wakes the equity market up and leads SPX lower (top panel). Note in the chart below, however, that Vix popped higher in 2012 without any noteworthy adverse reaction from SPX until mid-September.

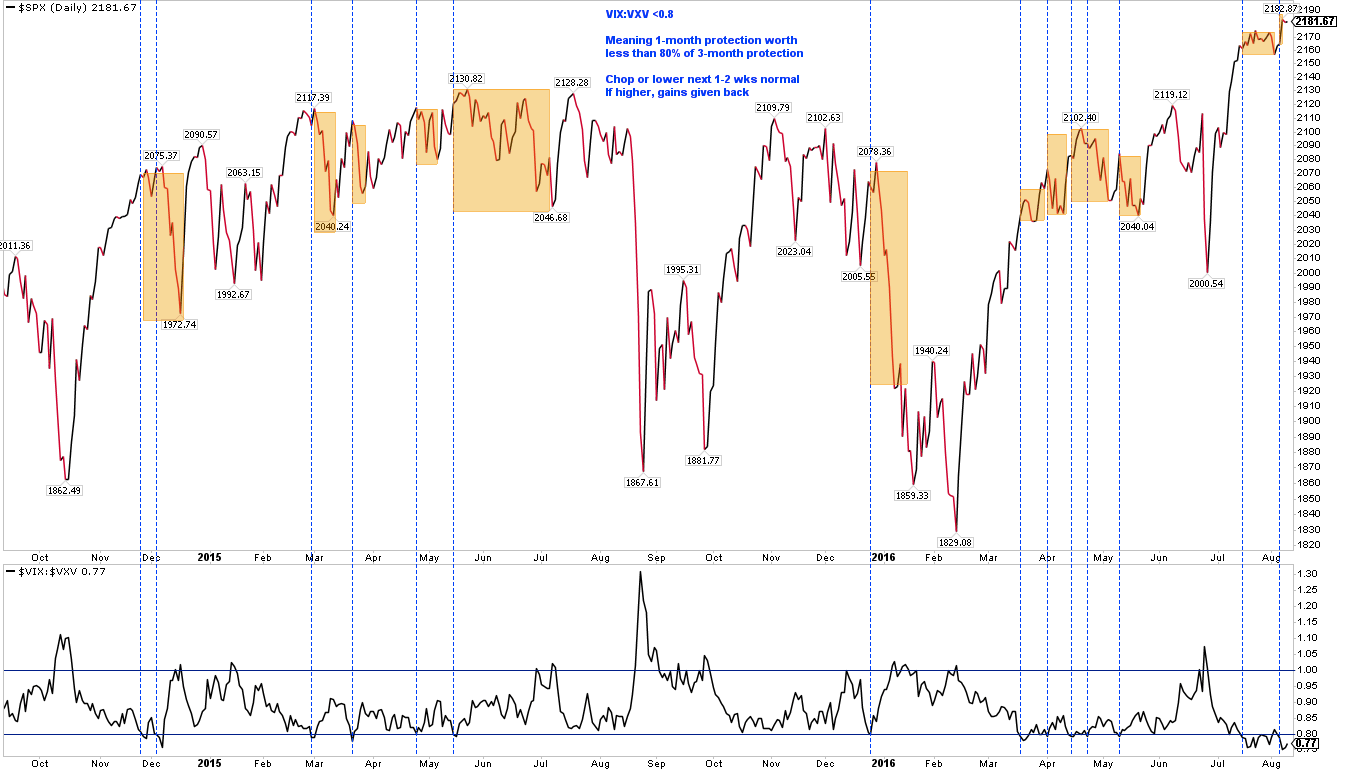
The volatility term structure, which compares one month volatility (Vix) to three month volatility (Vxv) is now also at an extreme. Over the past several years, when Vix trades at less than 80% of Vxv (lower panel), SPX has moved sideways or lower over the next 1-2 weeks; if SPX moved higher, those gains were given back before long (upper panel).
What does all of this imply? Traders with a short term time horizon should be on alert for a pop higher in volatility. "On alert" means watching for the trend in equities to weaken with consecutive closes below a short term moving average. This is key, since volatility can stay persistently low as SPX grinds higher. But the volatility term structure suggests the gains in SPX since last Thursday will likely be given back, and the pattern in August is for Vix to pop higher. That is also the pattern following very tight Bollinger Bands in SPX.
All of this is taking place as SPX moves to within 1% of the next "round number" milestone of 2200. A reminder: SPX has had a consistent tendency to react as it approaches each new "round number" milestone for the first time. The smallest reaction (2%) was in 2013 at 1800. Most often the reaction is more than 3%. The last two were 10% (at 2000) and 6% (at 2100). A move to the Bollinger middle band now implies a correction of about 4%.

If you find this post to be valuable, consider visiting a few of our sponsors who have offers that might be relevant to you.