SPX and DJIA have both risen 10 out of the last 12 days. SPX has made nine all-time highs (ATH) in the past 11 days. DJIA, NDX, the Euro 350, and the All World Ex-US index are all at bull market highs. EEM is at an 18-month high.
Meanwhile, lagging breadth has been repaired. 88% of SPX companies are above their 50-dma, the most since May 2013. Among the nine SPX sectors, seven are at bull market highs.

Moreover, the low volatility which is commonly associated with bullish markets continues, with Vix dropping on Friday to a 7 year low.
The intensity of buying in SPX seen in the last 12 days normally follows a decline into a bottom. The current run is therefore unusual, starting from a relative high. In the chart below, similarly intense buying periods are highlighted in yellow. That strength in momentum does not usually end suddenly. The momentum carries over.
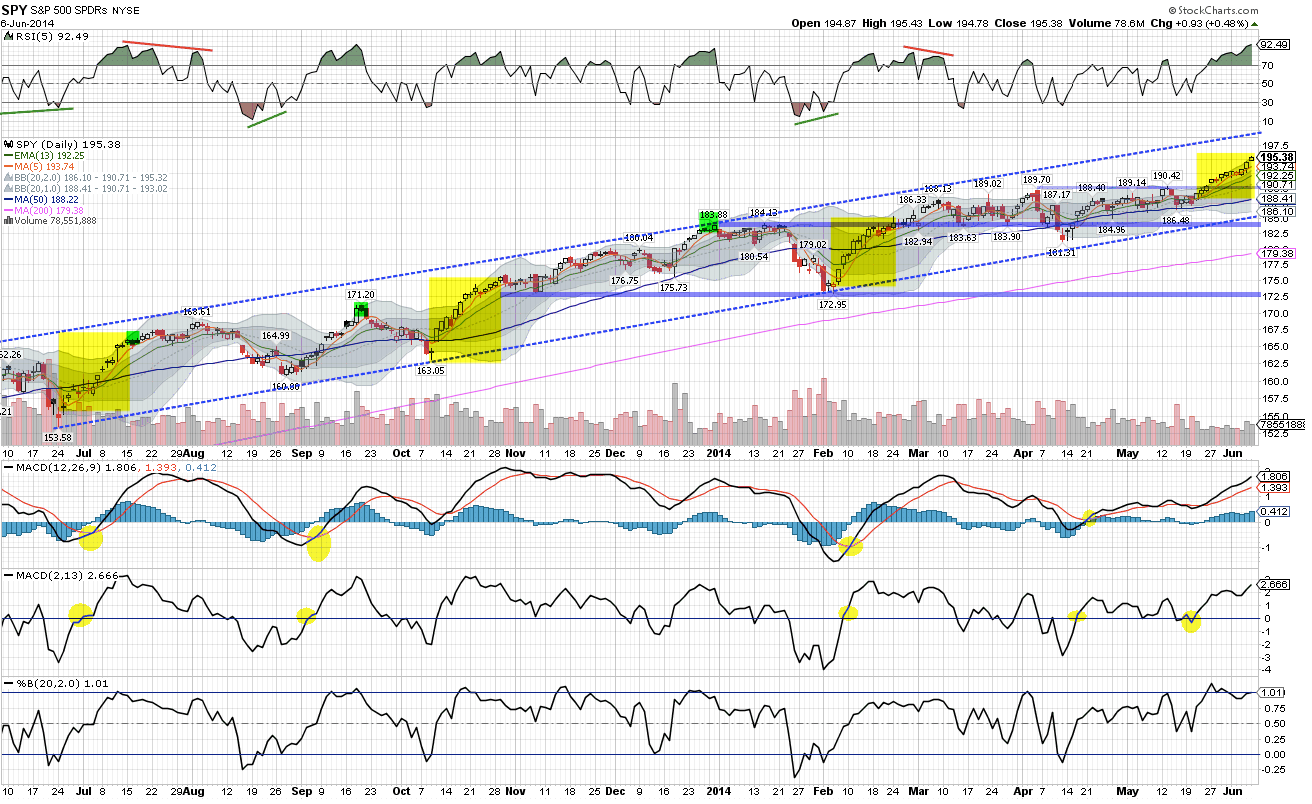
On all timeframes, SPX is now overbought. Starting with the daily chart above, highlighted in green are moments where RSI were as high as Friday. This suggests, at a minimum, some digestion of the prior weeks' gains is ahead. To watch is the development of a negative divergence that would indicate waning momentum. Not yet.
The overbought RSI is even more pronounced in the hourly chart for SPX. In fact, RSI has not been below 30 for nearly 3 weeks. This is highly unusual; 90% of the time, SPX is 'oversold' once per week. Highlighted in yellow are other long periods where SPX was overbought; the last time was in February, after which SPX dropped more than 1% in a day. A similar drop targets the 1920-30 support area.

The weekly chart shows SPX closed outside its upper Bollinger, at the top of its trend line from 2010 and with a RSI at a level where, again, the market has traded lower at least once over the course of the next several weeks (blue lines). There's no negative divergence and this is the first time the weekly has been overbought; normally the market will make a higher close in the weeks ahead.

There were two relevant studies that also suggest negative risk/reward near term. First, the number of stocks trading above their 20-ema hit 92% on Friday. Coming after 10% decline, this would be normal. But coming after an uptrend, the market has traded lower in the days ahead.

In the past 3 years, SPX lost an average of 1.5% at some point over the next 5 days; 80% traded lower (risk). The average run up, in comparison, was 0.5% (reward).

Secondly, equity put/call closed below 0.5 two of the last 3 days, showing a high level of investor confidence. In the past 3 years, SPX lost an average of 0.9% at some point over the next 5 days; 65% traded lower (risk). The average run up, in comparison, was 0.3% (reward).

Finally, although the sample size is small, its worth noting that SPX made a high on NFP day the last three months and then lost 2-4% in the next 2 weeks.
Other markets: To us, the risk/reward set up in mid-May was more attractive in RUT than SPX (post). In the event, RUT has since outperformed by over 200bp. The initial target was the 50-dma. As in December 2012 (highlighted in yellow), that area provided initial resistance before giving way on Thursday. RUT is now at the top of a potential right shoulder, but momentum is strong (no divergence) and the prior trend line above 1185 is probably the next target.

Outside the US, the emerging markets continue to be the most interesting. Valuations are low and funds have been hugely underweight. EEM has outperformed SPX on a 1-month and 3-month basis. This week it broke above 1-year resistance to an 18-month high. If we are continuing a period of global equity strength, there is an opportunity for funds to chase EEM much higher. Above $45 is the next area of strong resistance.

The asset class leader in 2014 is bonds. They outperformed US equities by 900 bp through the first 5 months of the year. TLT dropped to its 50-dma this week (yellow). That is also its 2014 trend line and it has held every swoon in recent months. That area needs to hold in the week ahead.

A loss of TLT's 50-dma (equal to 3.45% yield on TYX; chart below) would be a possible sign of improving growth and inflation prospects in the US. That has not been seen, yet, in the majority of macro data, which continues to show positive but modest growth of 3-4% (nominal). A recent post on this is here.

Better growth is probably the most crucial missing element of the equity rally. SPX is up 5.5% YTD, but less than half of this is due to earnings growth. This follows a similar pattern from the past 2 years: P/E expansion accounted for 80% of last year's market gains and 60% of the gains in SPX in 2012. Historically, that has not been sustainable.

The need for growth is even more crucial to European markets, hence the dramatic action undertaken this week by the ECB. In Europe, EPS has been falling the past 3 years, even while the hopes for future growth (as represented by the stock index) have been rising (chart from FactSet).


Two counterarguments suggesting that high valuations are warranted have been that companies are flush with cash and that interest rates are low. Neither is valid. Interest rates were lower in the 1950s yet P/Es never exceeded 19x. In fact, for most of that period, they were much lower while economic growth was much higher than today.

High cash balances are captured in company assets. Yet, using Tobin's Q, which measures price relative to the replacement cost of assets, current valuations are 2 standard deviations above the mean (chart from Doug Short).

Based on its current sales and earnings growth, fair value for SPX by year end is less than 1900. Even this is aggressive; SPX is trading at 1.7x sales while the peak during the prior bull market was 1.6x. Based on the mean (1.5x), fair value for SPX in December is nearer 1800. For more on these calculations, read here. Of course, exuberance means fair value is moot.

The first week in June is typically strong. That week has now passed and the next three are weaker (chart from Sentimentrader).

Our weekly summary table follows:

Note: There will be no weekly summary the next two weeks.