Equities made no progress in March. SPX was flat while RUT and NDX lost 3% or more. In comparison, treasuries, despite contrary comments by the Fed Chair, rose 1%. Given the torrid rise of equities in February, to say that March's lackluster performance was out of the consensus is a substantial understatement.
Entering 2014, analysts and pundits were expecting a repeat of 2013 (post). Things haven't turned out the way they expected.
Investors have been massively underweight both commodities (far right, red) and fixed income (purple), both of which have massively outperformed; and they are overweight equities, especially technology (third bar) and small caps (fourth bar), which have declined.

The same is true at the sector level. High beta continues to be in favor yet it has been resoundingly beaten by defensive sectors, especially utilities, so far this year. Consumer staples started the year weakly but have been the best sector since mid-February.

A combination of factors account for the performance of assets so far in 2014.
The most important is expectations. Small caps have rallied seven straight quarters, the longest stretch ever. Their valuations are now 26% above even those of the late 1990s. Investors are paying 50 times earnings (article).
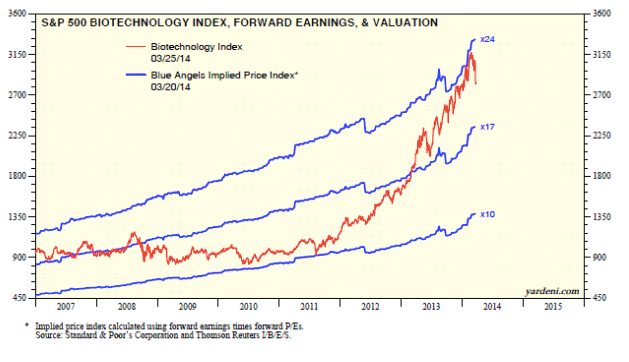
Speculative biotech is even more extreme. Virtually all their performance in the past 18 months has been driven by revaluation (i.e., expectations) and not by realized growth (chart from Yardeni).
Investors' exuberance is well ahead of real growth. Most of the data point to growth of approximately 2-3%. This is the trend in SPX sales as well as in macro indicators. This week, for example, durable goods orders (excluding defense) were reported to have grown just 0.8% in the past year.

Real final sales (GDP less changes in inventories) is similarly growing at less than 2%. Net, consumption is growing, but it's sluggish and out of line with expectations.

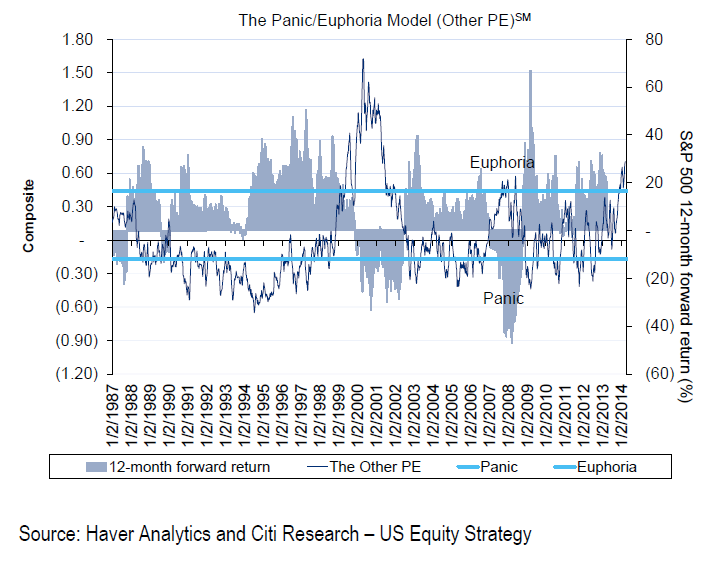
Remarkably, the underperformance of equities has gone unnoticed by investors. The Citibank Panic/Euphoria model is reaching new 14-year highs even as stocks go nowhere. The implication is negative 12-month forward returns.
Similarly, the Investor Intelligence bull/bear ratio has now been over 3 for most of the past 5-months, longer than any time since 1980s. In two of the prior times, equities went sideways for the next 6-18 months; in the other, stocks gave one final push before dropping over 30%.

The current period is similar in many ways to 2005. Then, like now, total put/call ratios stayed below 1.0 for five months until mid-March. Investors' expectations were solidly in-line with further upside. What transpired instead was a choppy market with no appreciation until the final two months of the year.

What is particularly striking is the relative performance of sectors; then, like now, defensives, especially utilities, trounced cyclicals.

Net, the longer term picture is of a market that seems unlikely to runaway to the upside in the months ahead. What about nearer term?
All of the major ex-US indices as well as DJIA, NDX and RUT have been below their 50-dma in the past week. The only exception is SPX.
Objectively, SPX is holding the January pivot highs and there is no 'lower low' yet. But note the decline in its 13-ema again, which in the past has portended a touch of its 50-dma ahead. For the time being, 184 remains the key support.

On the hourly timescale, the sideways action is more apparent. The index is rangebound until either 188 or 184 breaks. The 50-dma is just below at 183.

The market appears to be setting up for an increase in volatility. The apparent pattern is a contraction in range that precedes a spike in volatility. Normally the move is down. This would amount to SPX following the lead of NDX and RUT to its 50-dma and lower.

Also note that volatility spiked a week ago and that those spikes have tended to come in pairs 1-2 weeks apart. This suggests that pattern is getting near a trigger.
Should that transpire, we will look for several markers: a spike in Trin over 2, a drop in NYMO under -80, a spike in CPC over 1.2. We will also be looking at breadth: at the recent lows, the percent of SPX stocks trading under their 20-ema has dropped to 20-30%. It's currently above 40%.

Seasonality supports one last push higher over the next several weeks. April trading starts Tuesday. Only two days in the next three weeks are weak (chart from Sentimentrader).

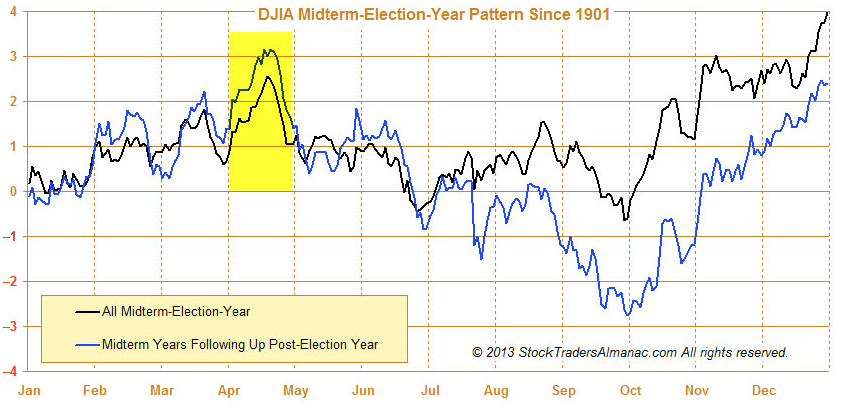
That also fits the mid-term election cycle pattern. April during mid-term years are flat on average, but note the ramp from the end March to mid-April (chart from Stock Almanac).
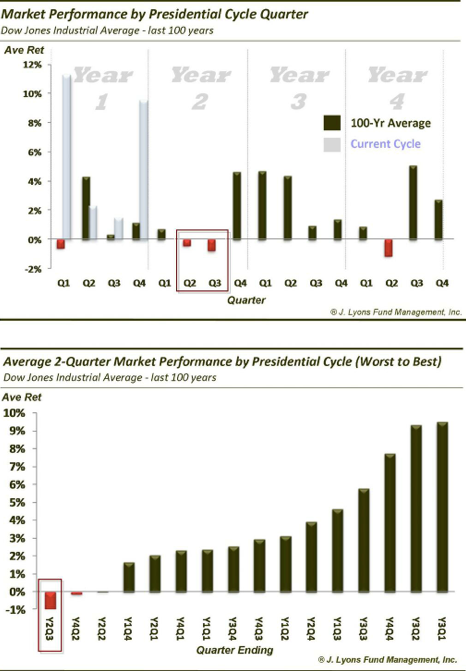
From there, seasonality becomes very bearish. You can see in the chart above and in the one below that the best three months of the year are now past. The next six months are toughest. It is not encouraging that equities have struggled against this positive backdrop heading into the next two quarters. This pattern fits the larger context of the current market, one where equities are unlikely to run substantially higher in the next several months (chart from J Lyons Fund).
Our weekly summary table follows.
