February is the weak link in the 6 month chain. Seasonal strength returns in March and April.
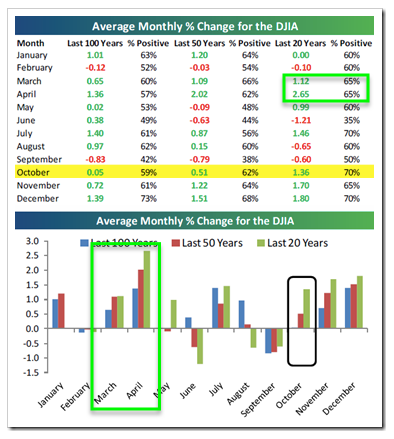
In the first chart (from SentimenTrader), you can see that March and April are up 65% of the time on average for 1 to 2.6% gains each month.
The second chart (from David Stendahl) shows March and April are strong whether viewed over the past 5, 10 or 15 years. Adding granularity, March seems to start weak and then rip from mid-month onwards.
The potential fly in the ointment is that in post-election years, March is weak (see third chart). As Stock Trader's Almanac says: "In post-election years, March ranks 5th worst for DJIA, S&P 500 and Russell 2000. NASDAQ is 4th worst. In 10 post-election years since 1973, NASDAQ has advanced just four times in March."
Getting too granular or literal on seasonality is not a great investing approach in the absence of other confirming factors. That said, April is typically solid, and if March presents a nice dip, seasonality is a tailwind on the long side (see fourth chart).
Charts below.
March and April are typically among the strongest months of the year (green boxes).
March seems to start weak and then rip from mid-month onwards, through at least the end of April.

In post-election years, March ranks 5th worst for DJIA, S&P 500 and Russell 2000. NASDAQ is 4th worst. In 10 post-election years since 1973, NASDAQ has advanced just four times in March.

April is typically solid; if March presents a nice dip, seasonality is a tailwind on the long side. A nice chart from @ariwald shows this well.
